Statistical Visualizations with {ggstatsplot}: A Biography

Indrajeet Patil
ggstatsplot hexagonal logo: a person reading a book of statistics and plots.

Genesis

Why a new software?

Life in the trenches (c. 2017, Harvard)

External Stimulus

  • Reporting errors:

“half of all published psychology papers contained at least one p-value that was inconsistent”1

  • Interpretation errors:

“in 72% of cases, nonsignificant results were misinterpreted [to mean] that effect was absent”2

  • Replication crisis:

“39% of effects were subjectively rated to have replicated the original result”3

and more…

Internal Response

A dog sits in a burning room saying, This is fine, illustrating complacency amid research problems. How to:

  • avoid reporting errors?
  • improve quality of statistical reporting?
  • emphasize the importance of the effect?
  • interpret null results?
  • easily assess validity of model assumptions?
  • increase replicability?

Proposal

Information-rich, ready-made statistical visualizations

(minimal effort and maximum transparency)

A visualization with statistical summary
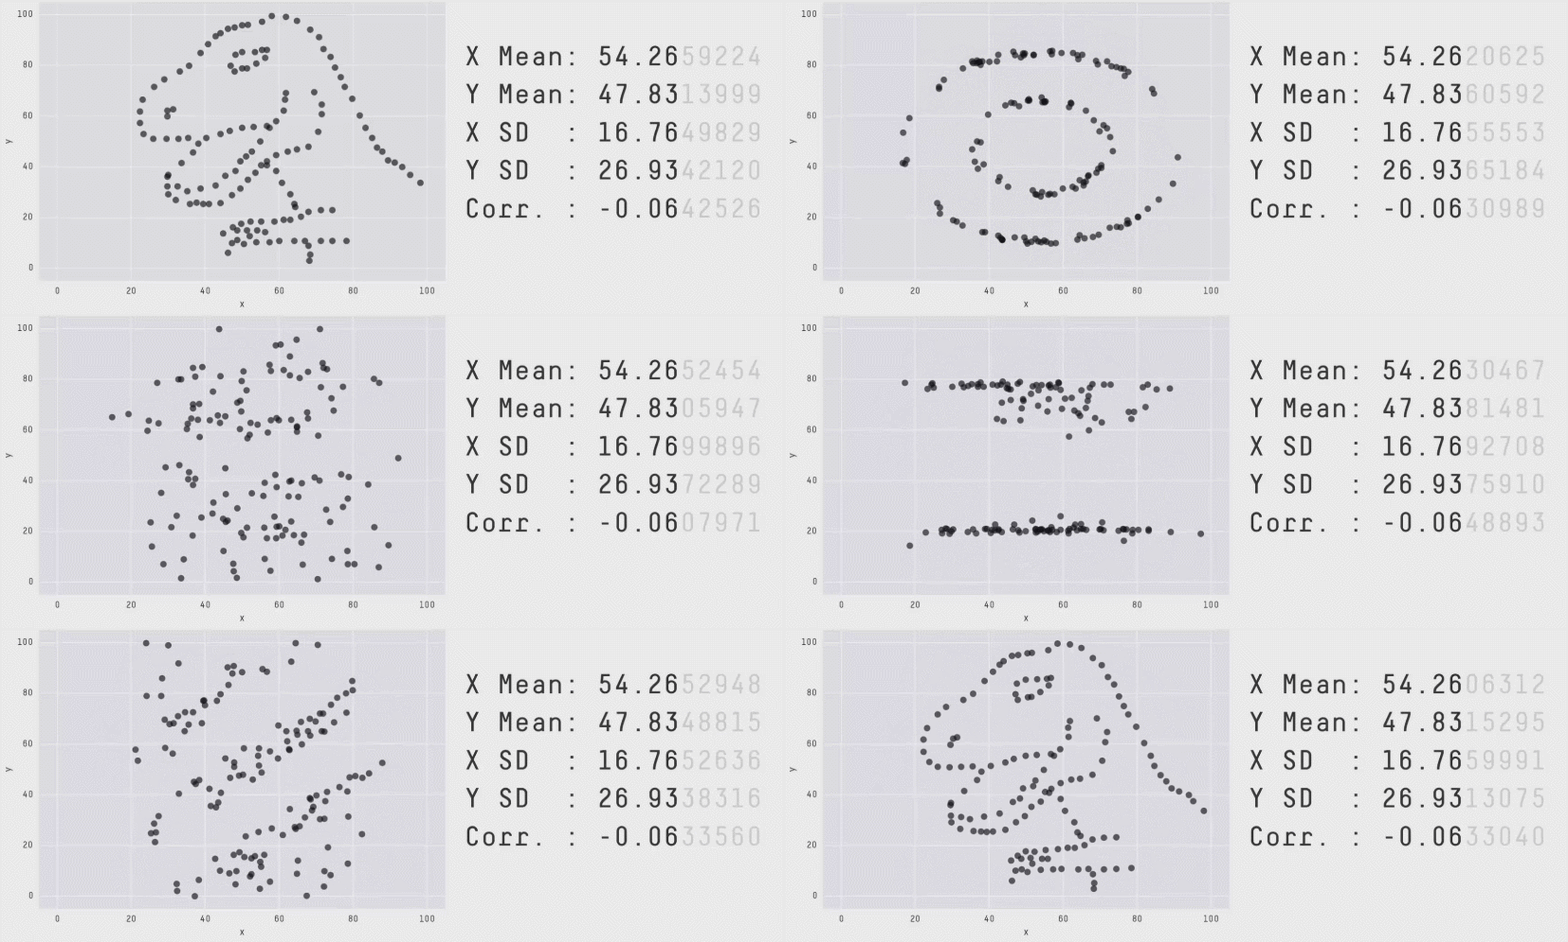
Animated scatterplots change shape while their means, standard deviations, and correlation remain nearly identical, showing why summary statistics alone can mislead.

💡 Visualizations reveal problems not discernible from model summaries!

Ready-made plots with one-line syntax


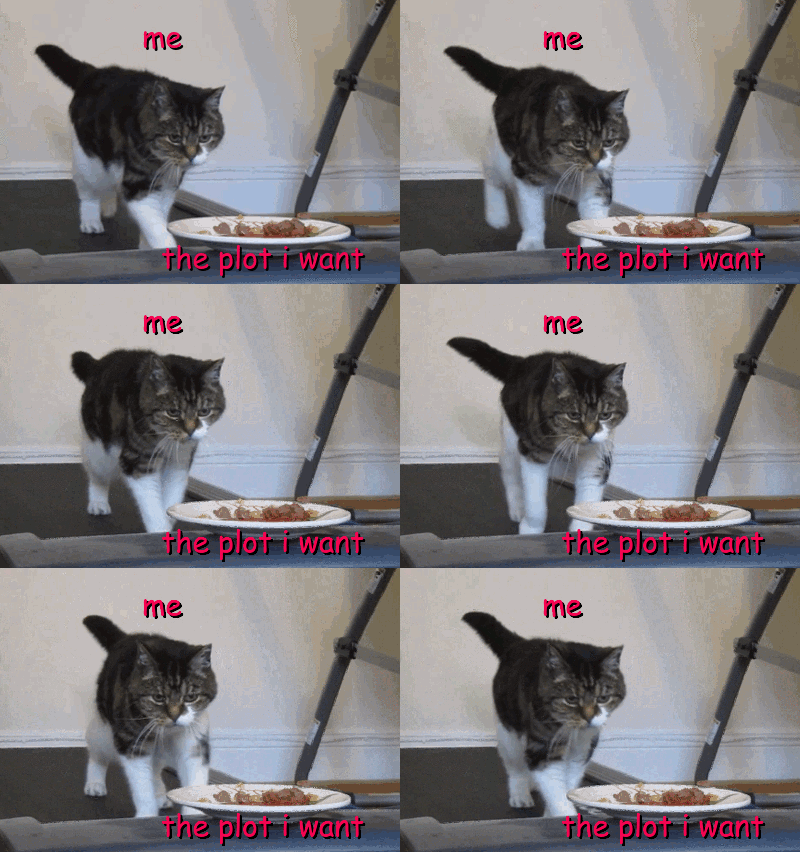
The grammar of graphics framework can prepare any visualization! But building plots from scratch can be time-consuming.
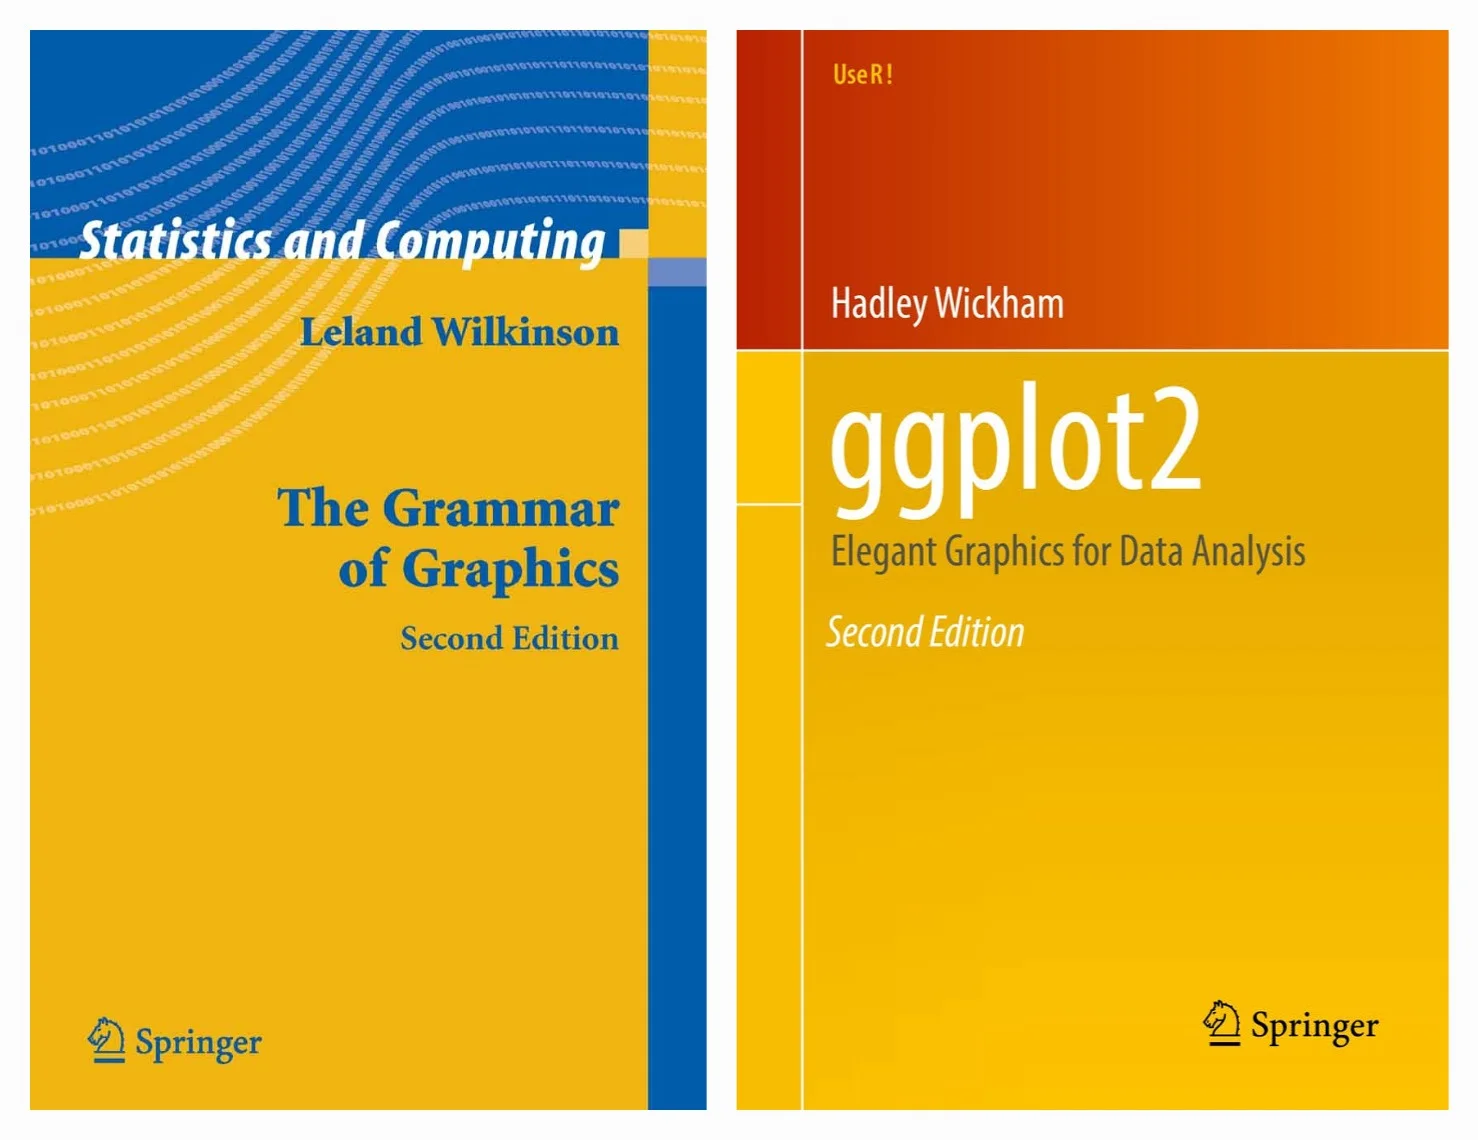
Covers of The Grammar of Graphics by Leland Wilkinson and ggplot2: Elegant Graphics for Data Analysis by Hadley Wickham.

A cat on a treadmill reaches for food labeled the plot I want, illustrating the effort of building plots manually.


💡 Using ready-made plots lowers the effort needed for visualizing data!

Action Plan

ggstatsplot was born!

(open-sourced on GitHub in 2017; still actively developed)

Example function

E.g., for hypothesis about differences between groups

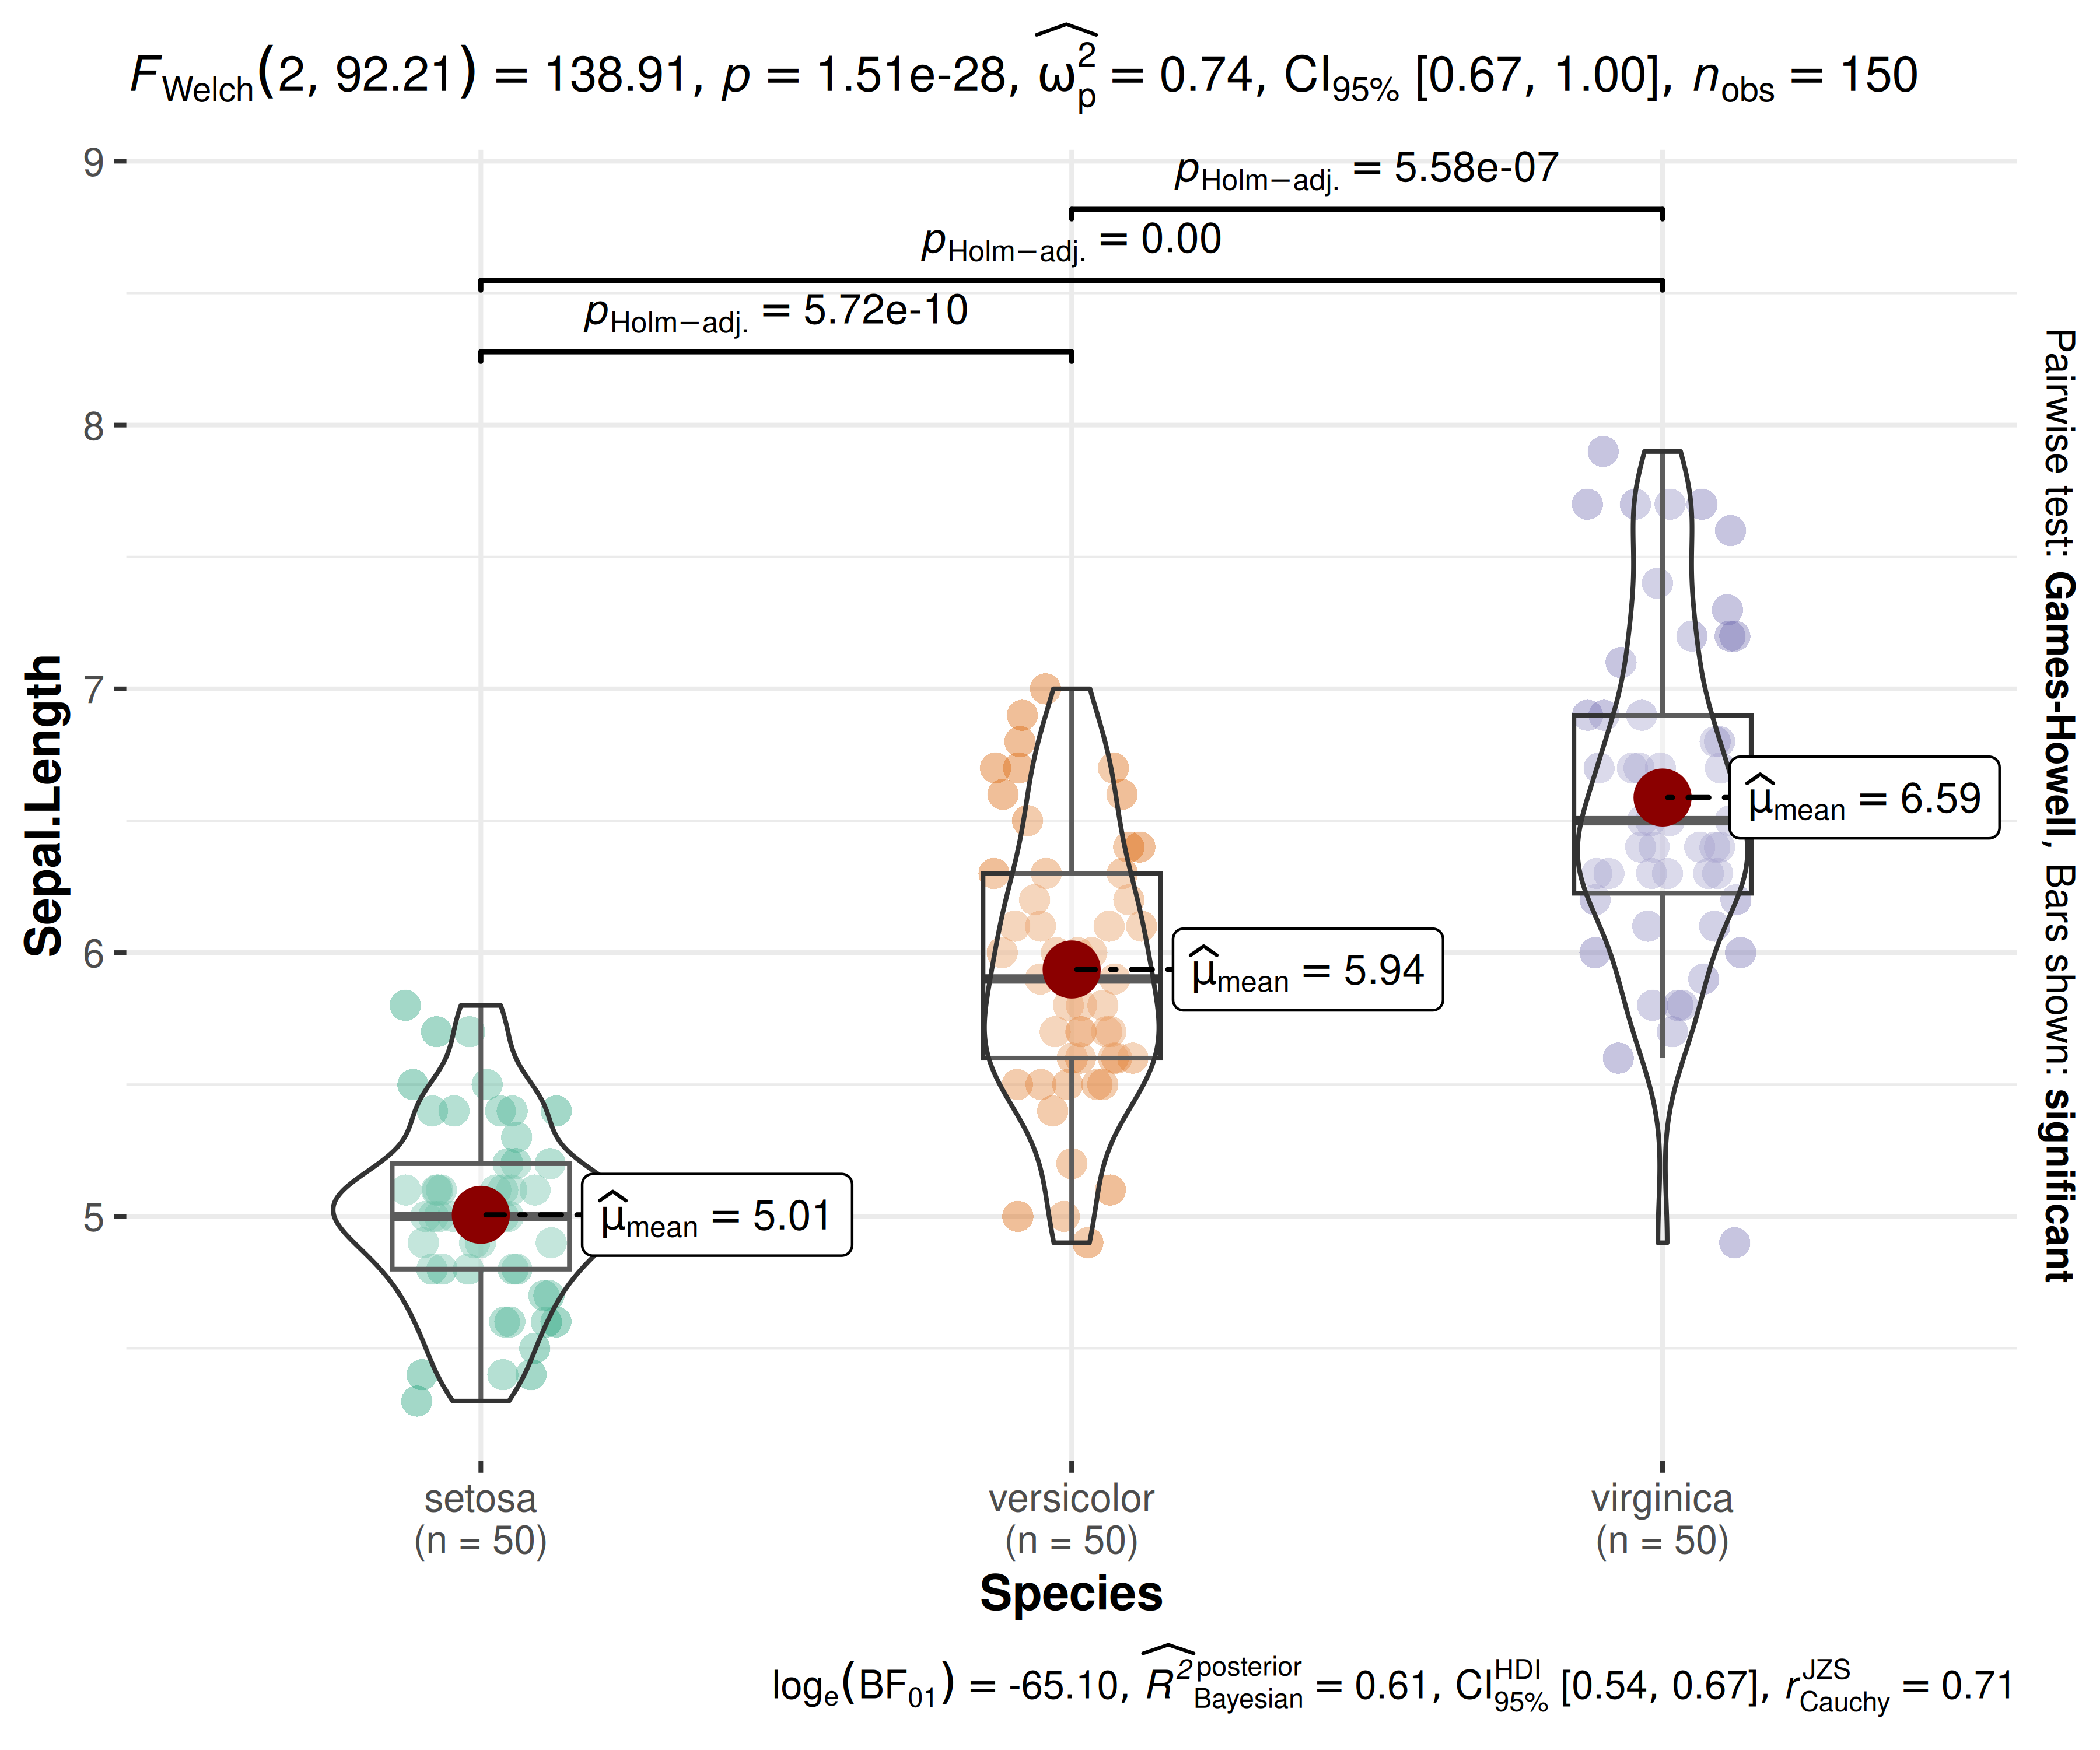
ggbetweenstats(iris, Species, Sepal.Length)

Sepal length distributions for the three iris species, with raw observations, group means, uncertainty, and statistical comparisons.

Important

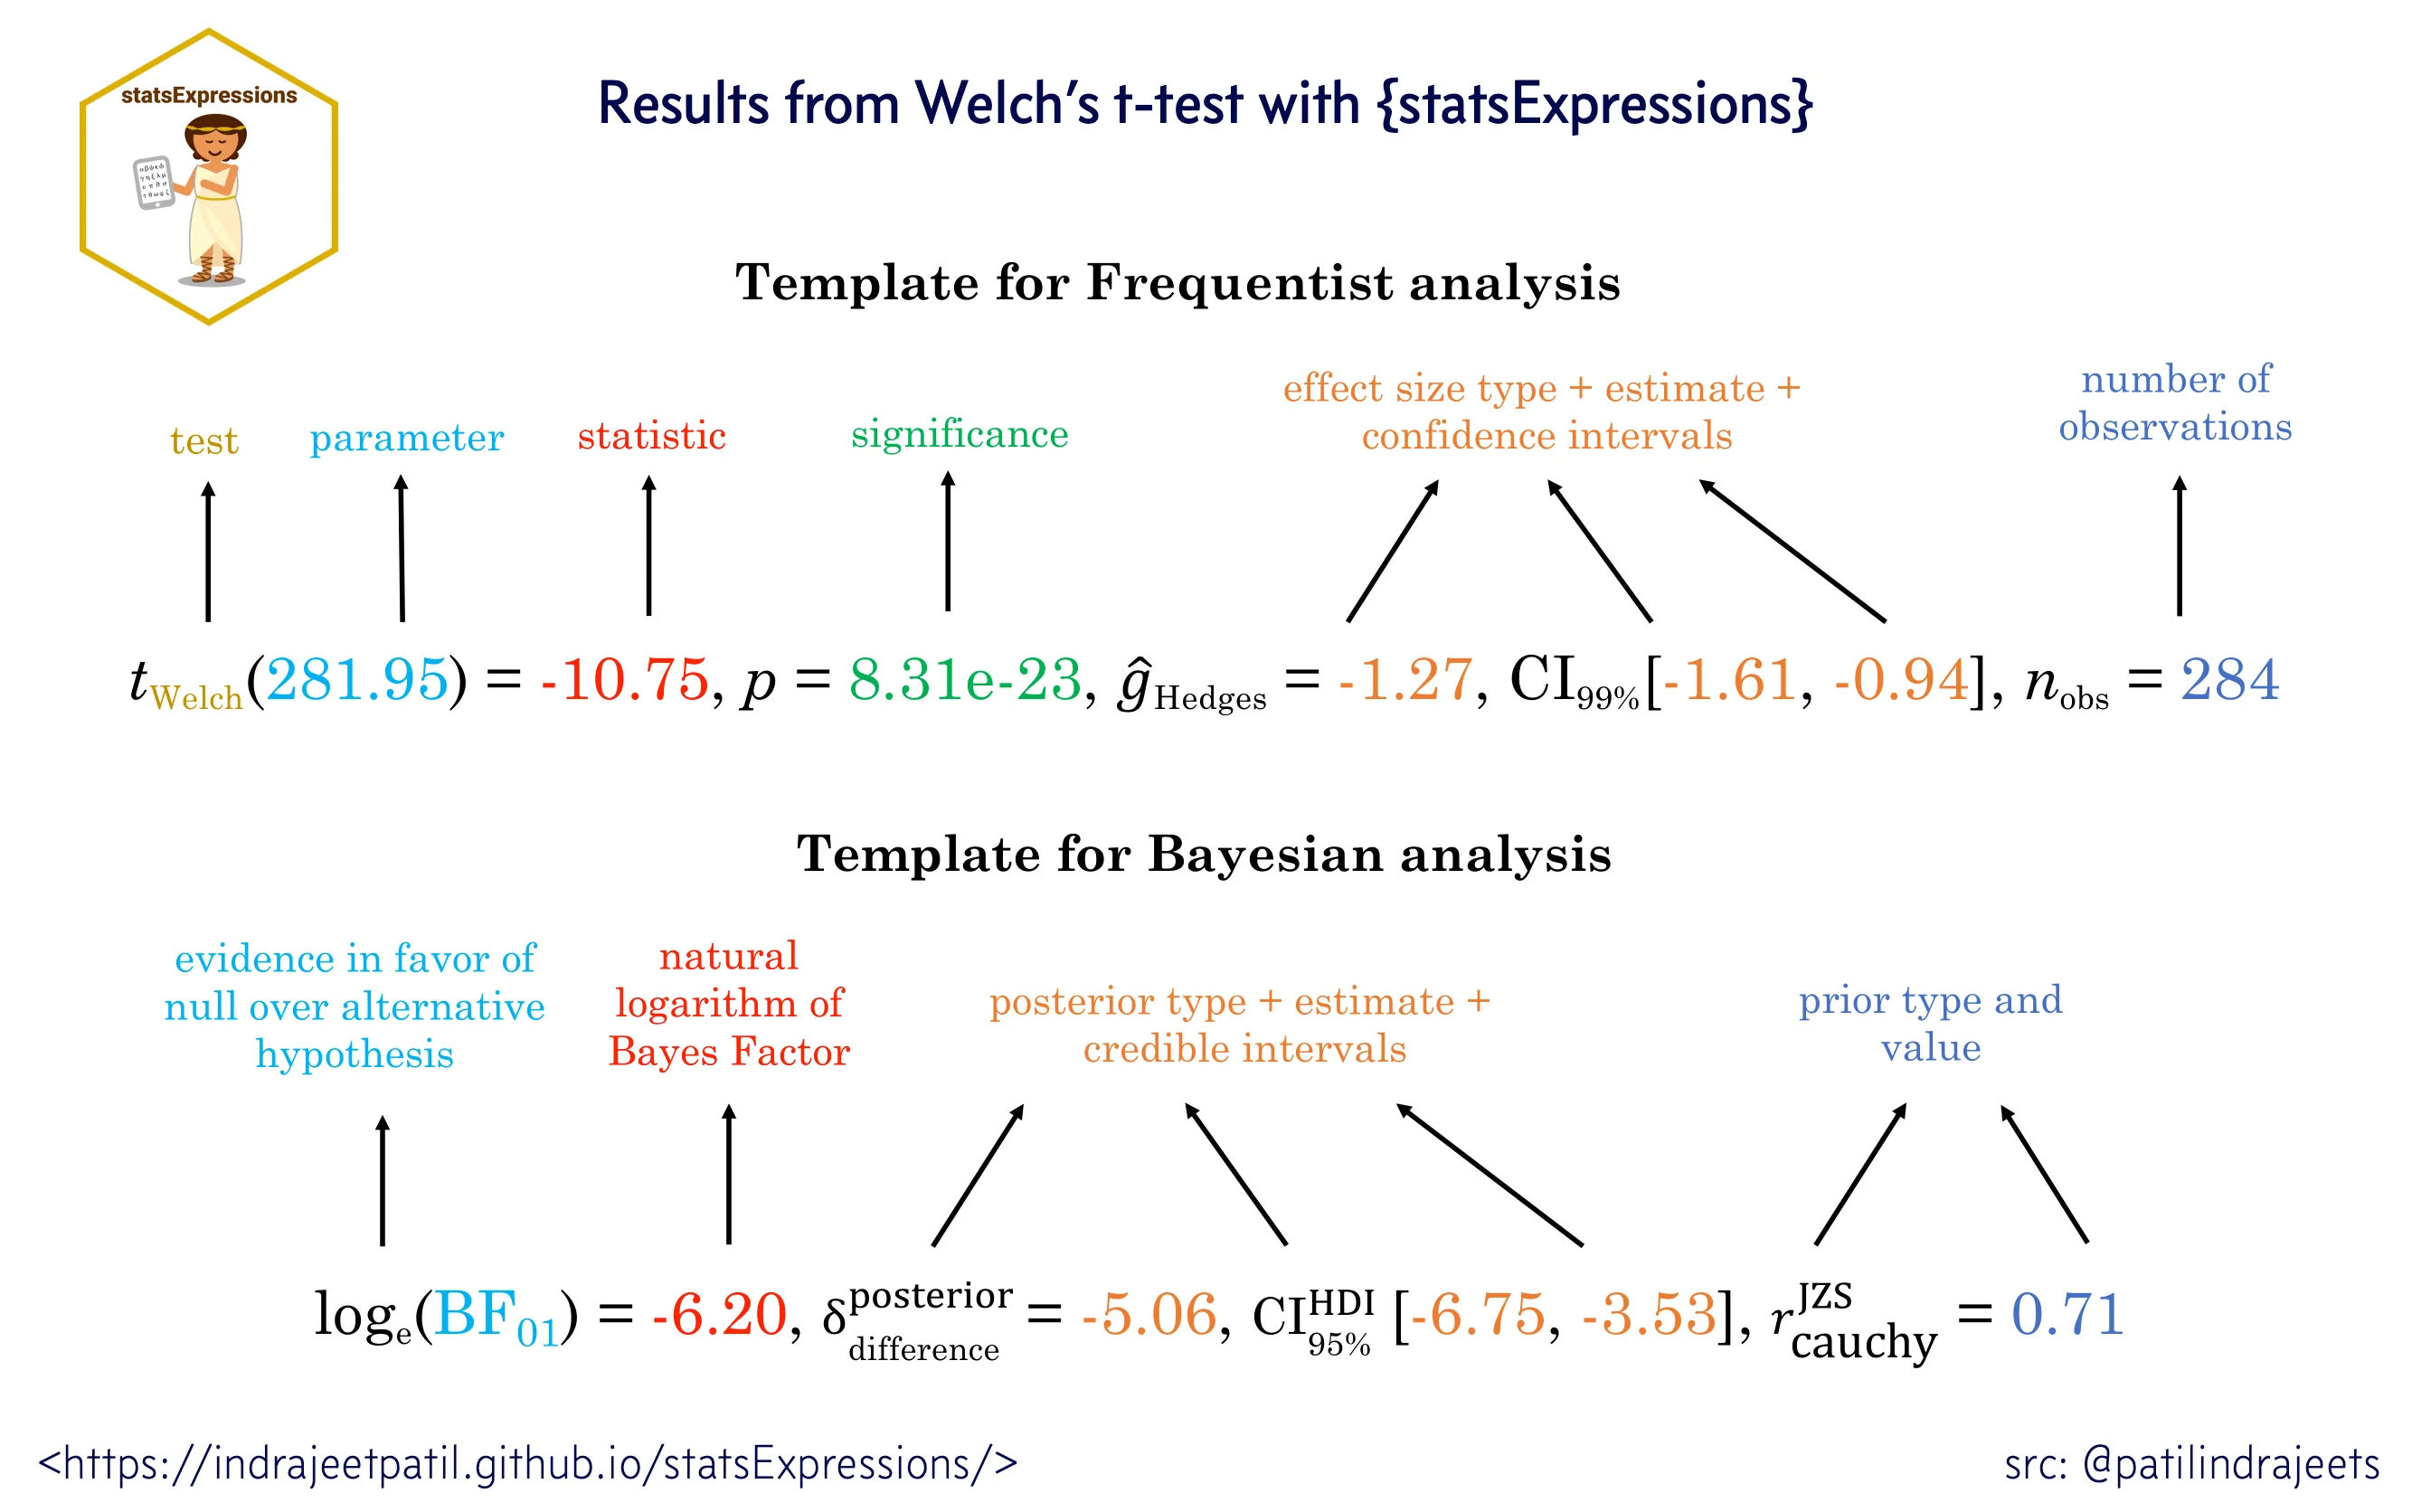
Information-rich defaults

  • raw data + distributions
  • descriptive statistics
  • inferential statistics
  • effect size + uncertainty
  • pairwise comparisons
  • Bayesian hypothesis-testing
  • Bayesian estimation

Statistical approaches available

  • parametric
  • non-parametric
  • robust
  • Bayesian

And there is more!

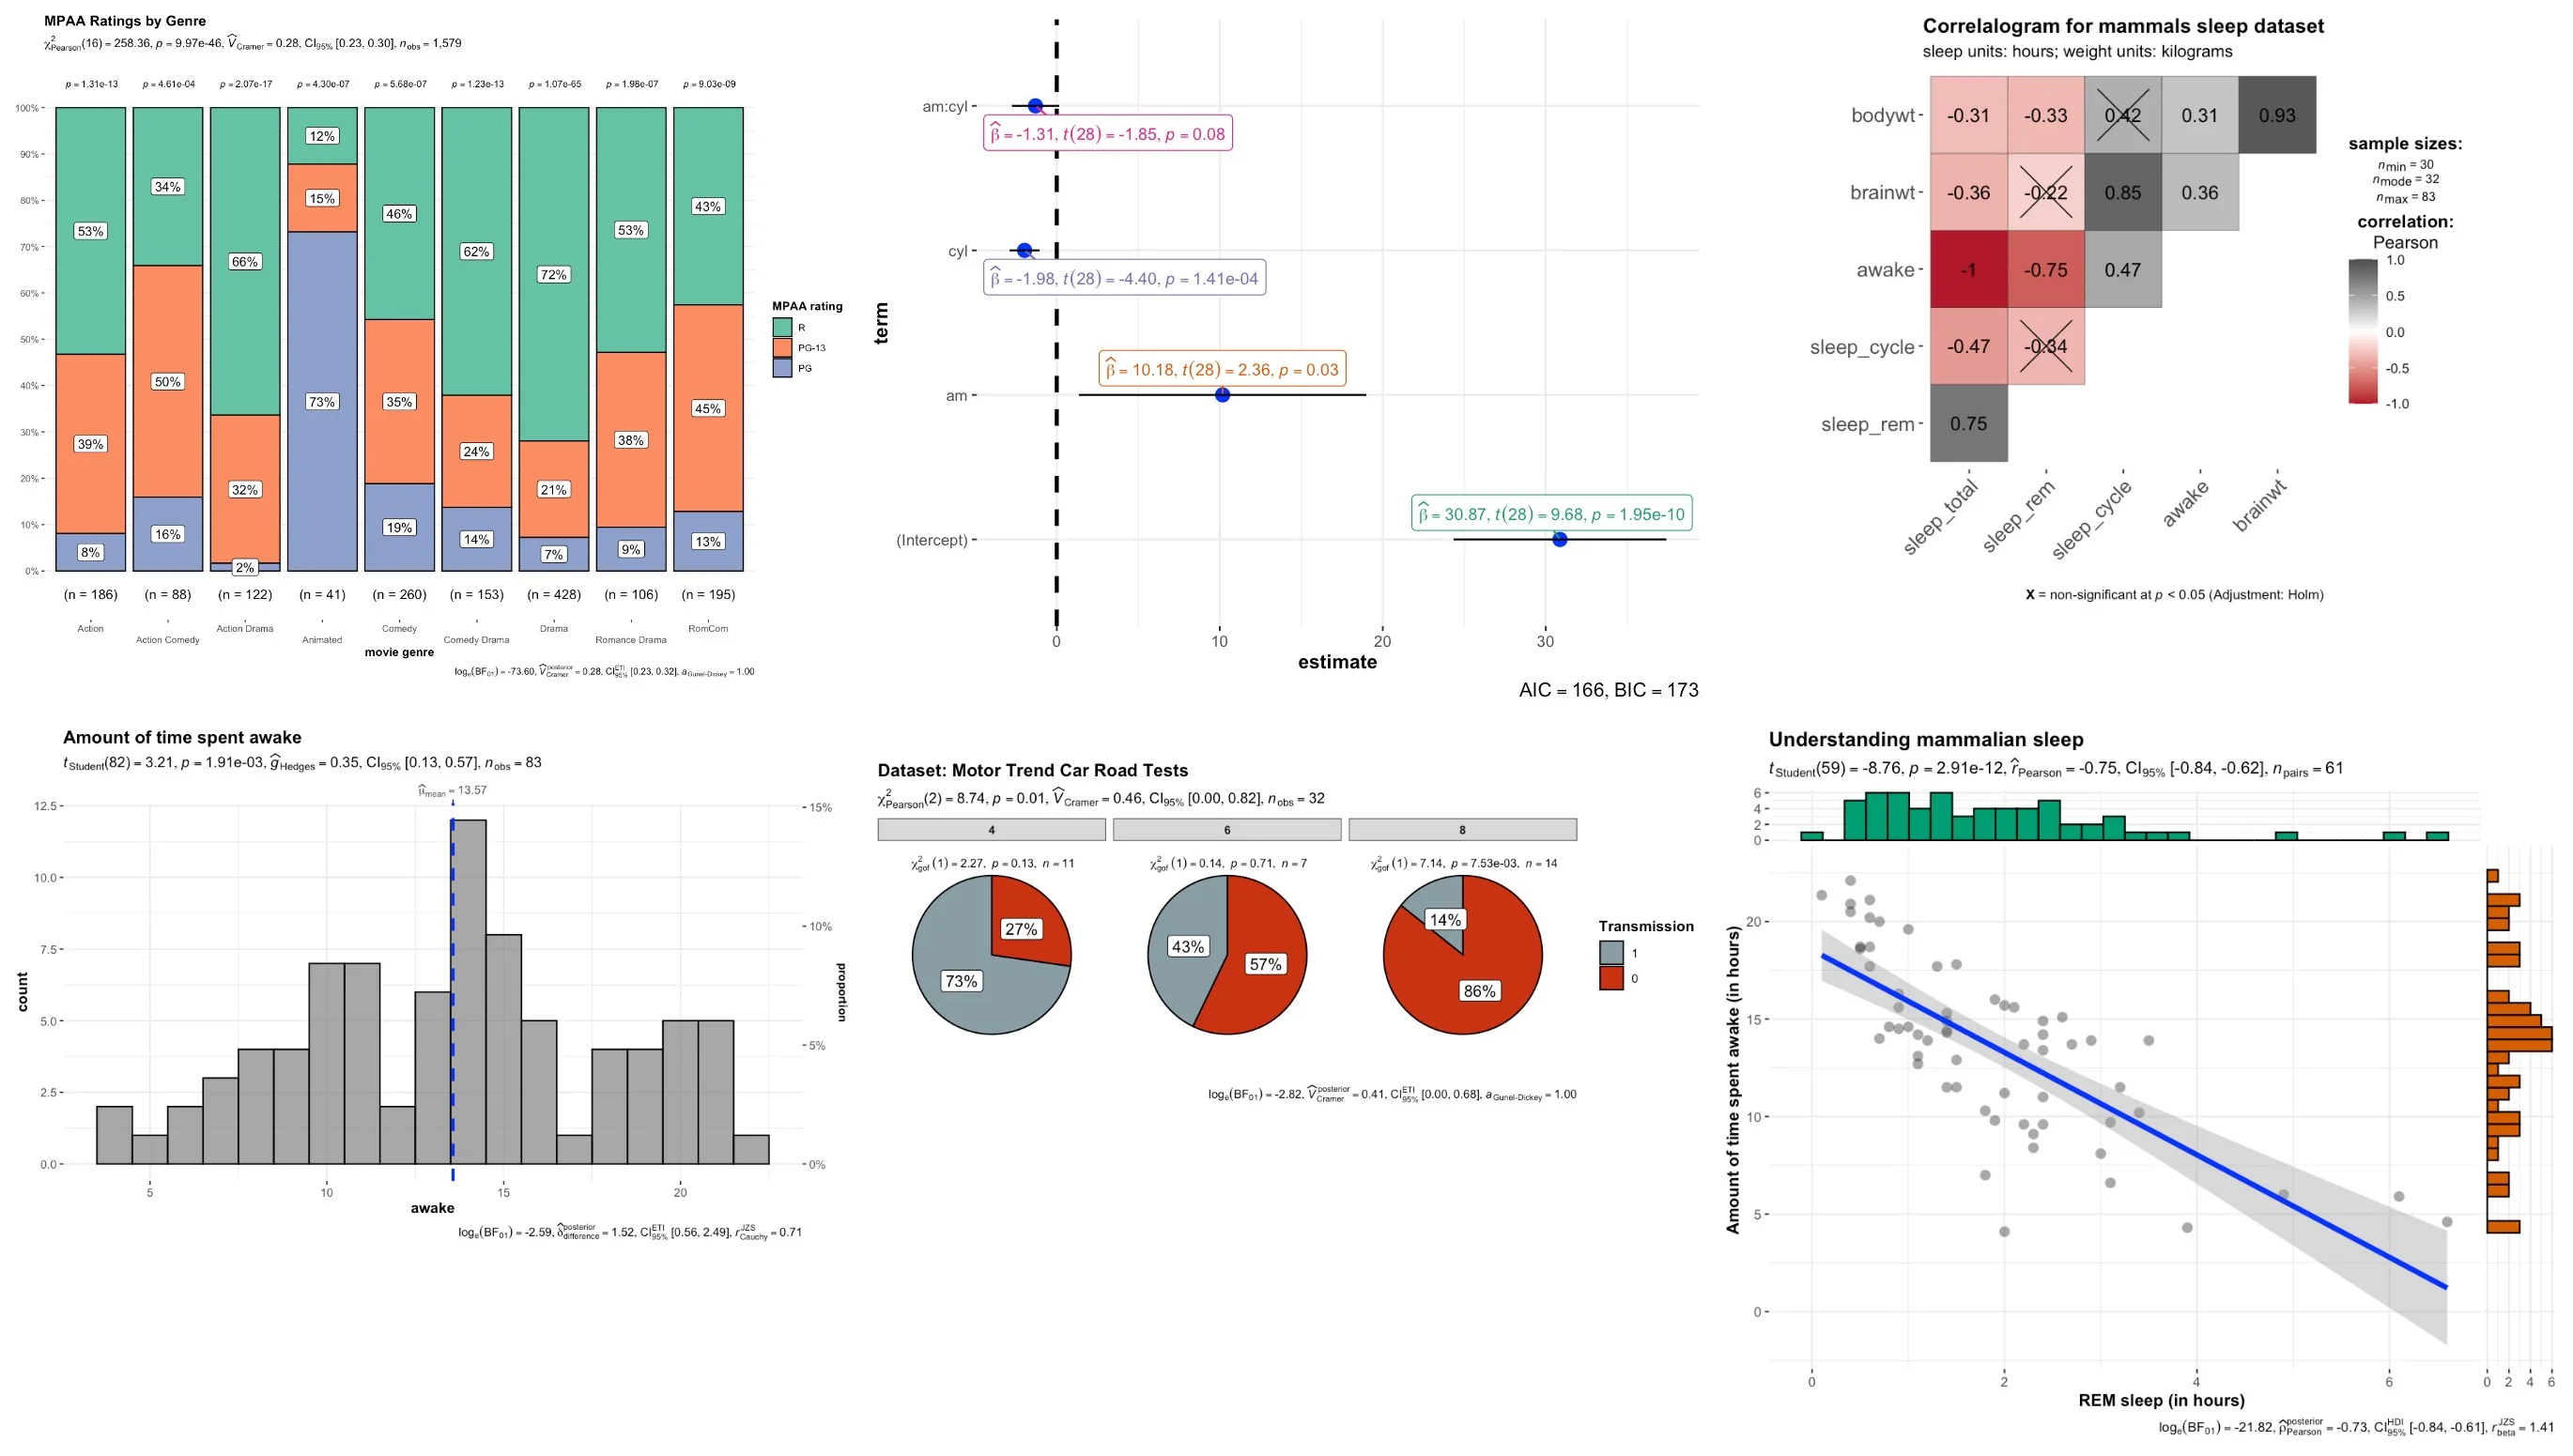
Examples of ggstatsplot output: stacked bars, regression coefficients, correlation matrix, histogram, grouped pie charts, and a scatterplot with marginal distributions.

Promised Land

Does it deliver?

Show, don’t tell

Without ggstatsplot

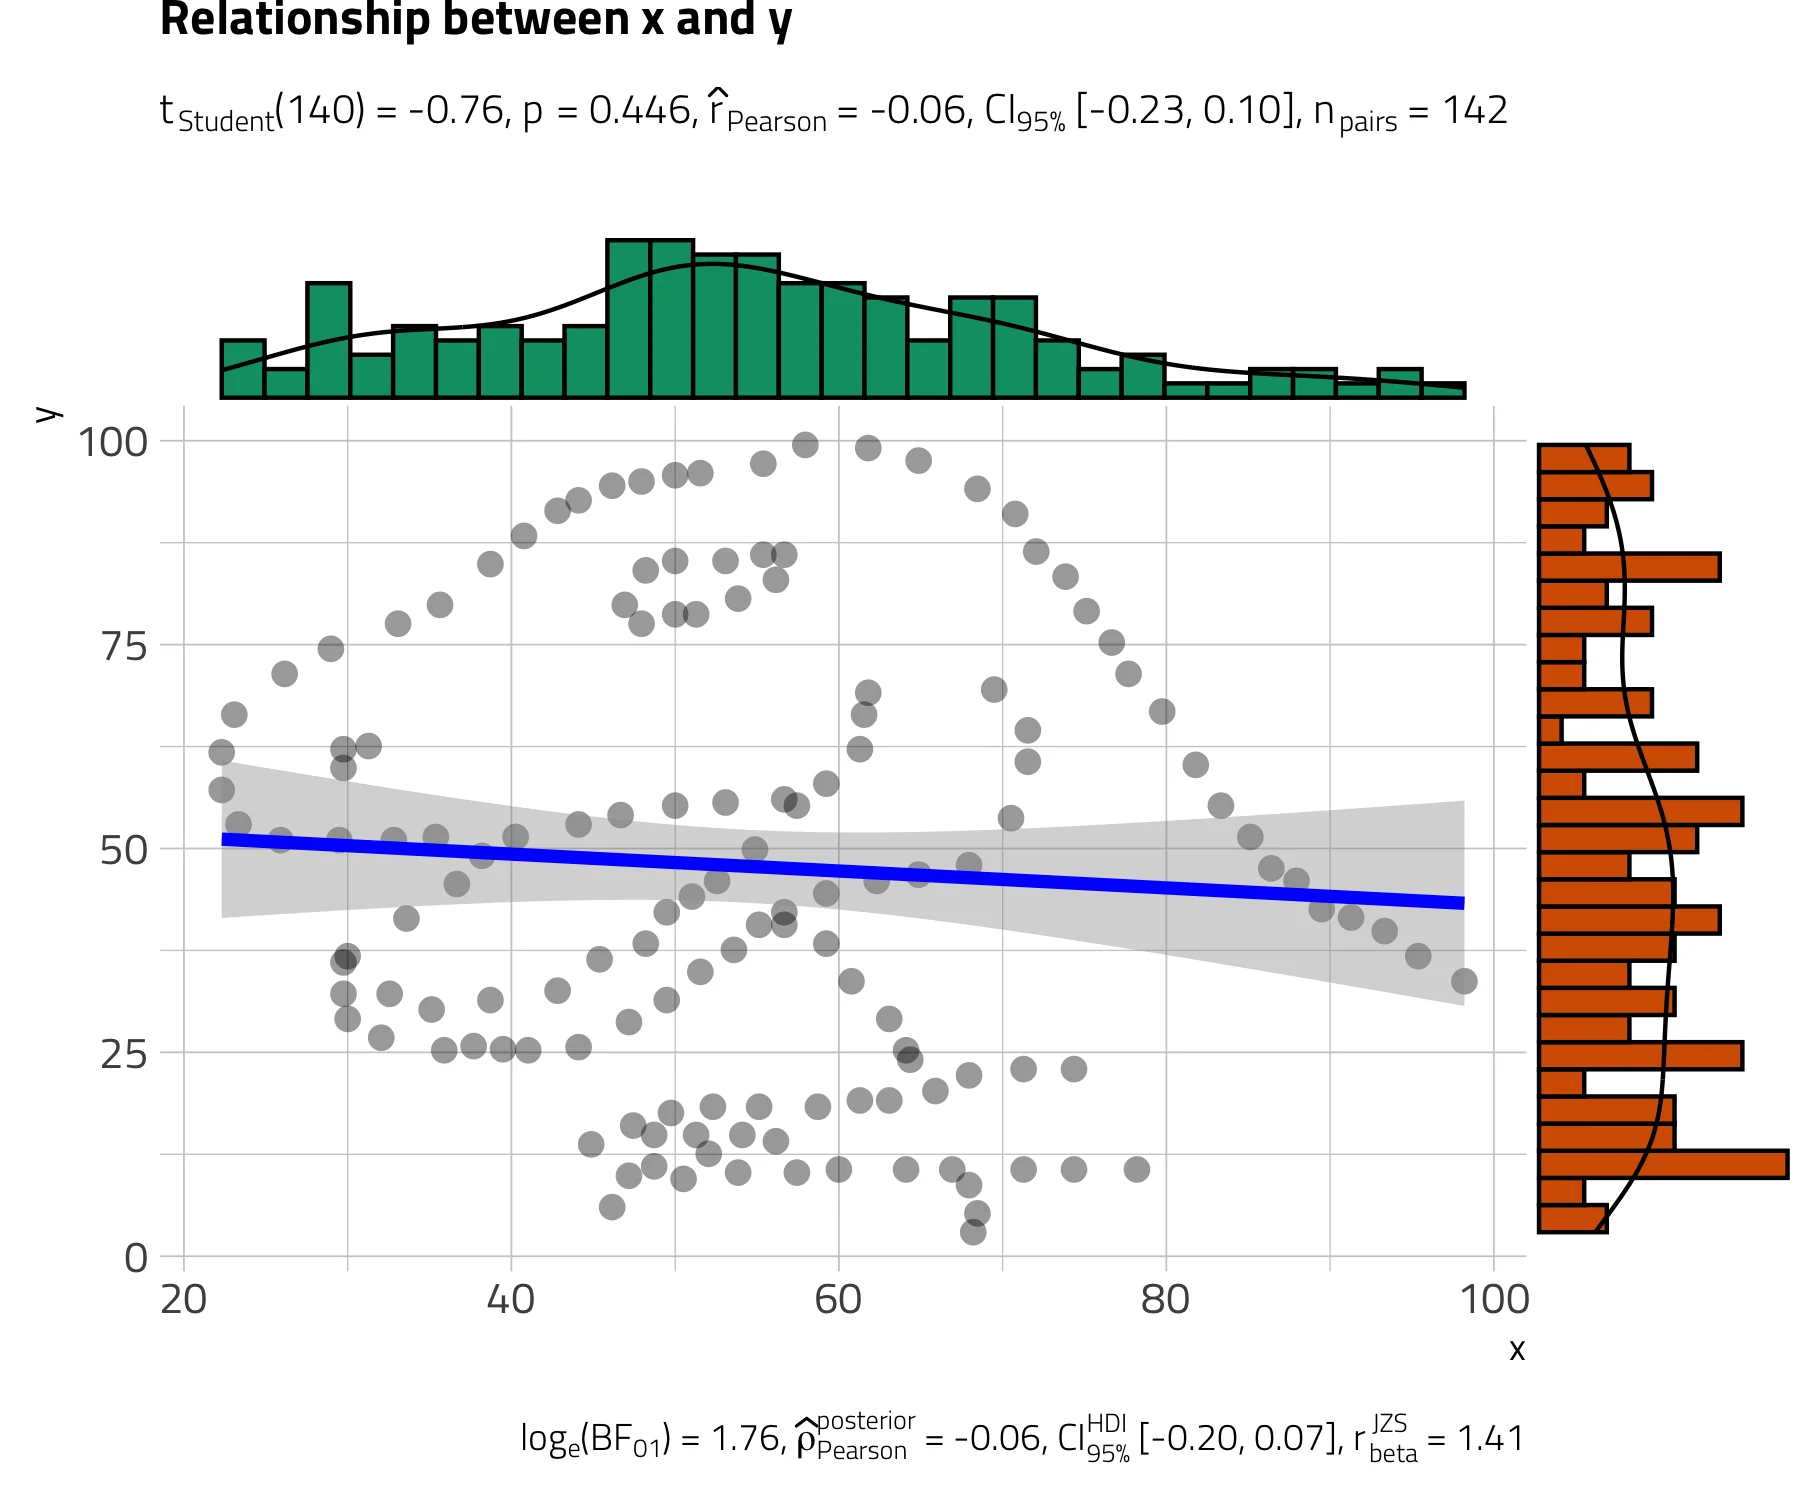
Pearson’s correlation test revealed that, across 142 participants, variable x was negatively correlated with variable y: \(t(140)=-0.76, p=0.446\). The effect size \((r=-0.06, 95\% CI [-0.23,0.10])\) was small, as per Cohen’s (1988) conventions. The Bayes Factor for the same analysis revealed that the data were 5.81 times more probable under the null hypothesis as compared to the alternative hypothesis. This can be considered moderate evidence (Jeffreys, 1961) in favor of the null hypothesis (absence of any correlation between x and y).

✅ No need to worry about reporting or interpretation errors!

Thoughtful Defaults

Data Visualization
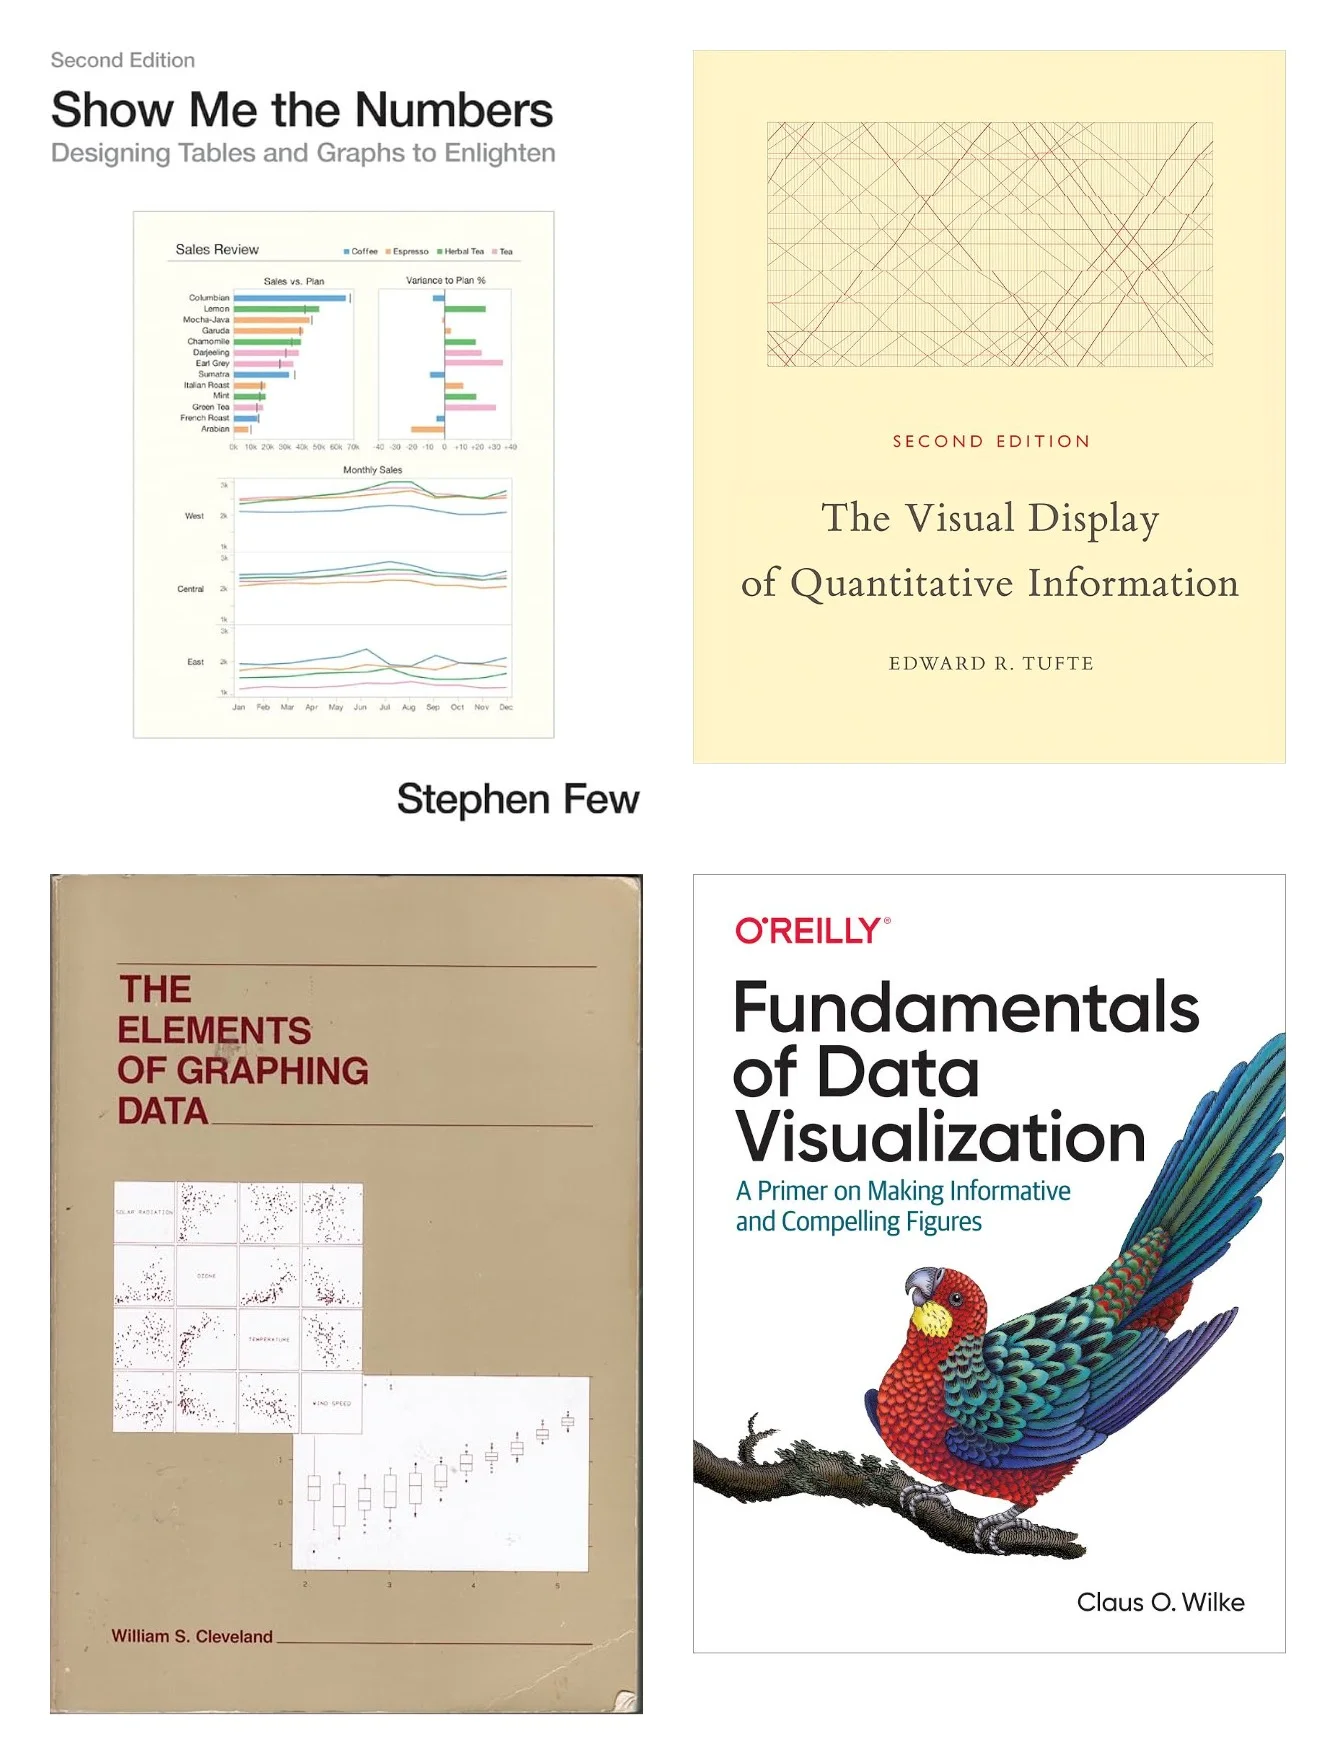
Covers of visualization references by Stephen Few, Edward Tufte, William Cleveland, and Claus Wilke that inform the plotting defaults.

Statistical Reporting

✅ Follows best practices in data visualization and statistical reporting!

Impact

I can haz users?!

User Love

Total downloads > 800K (97 percentile)
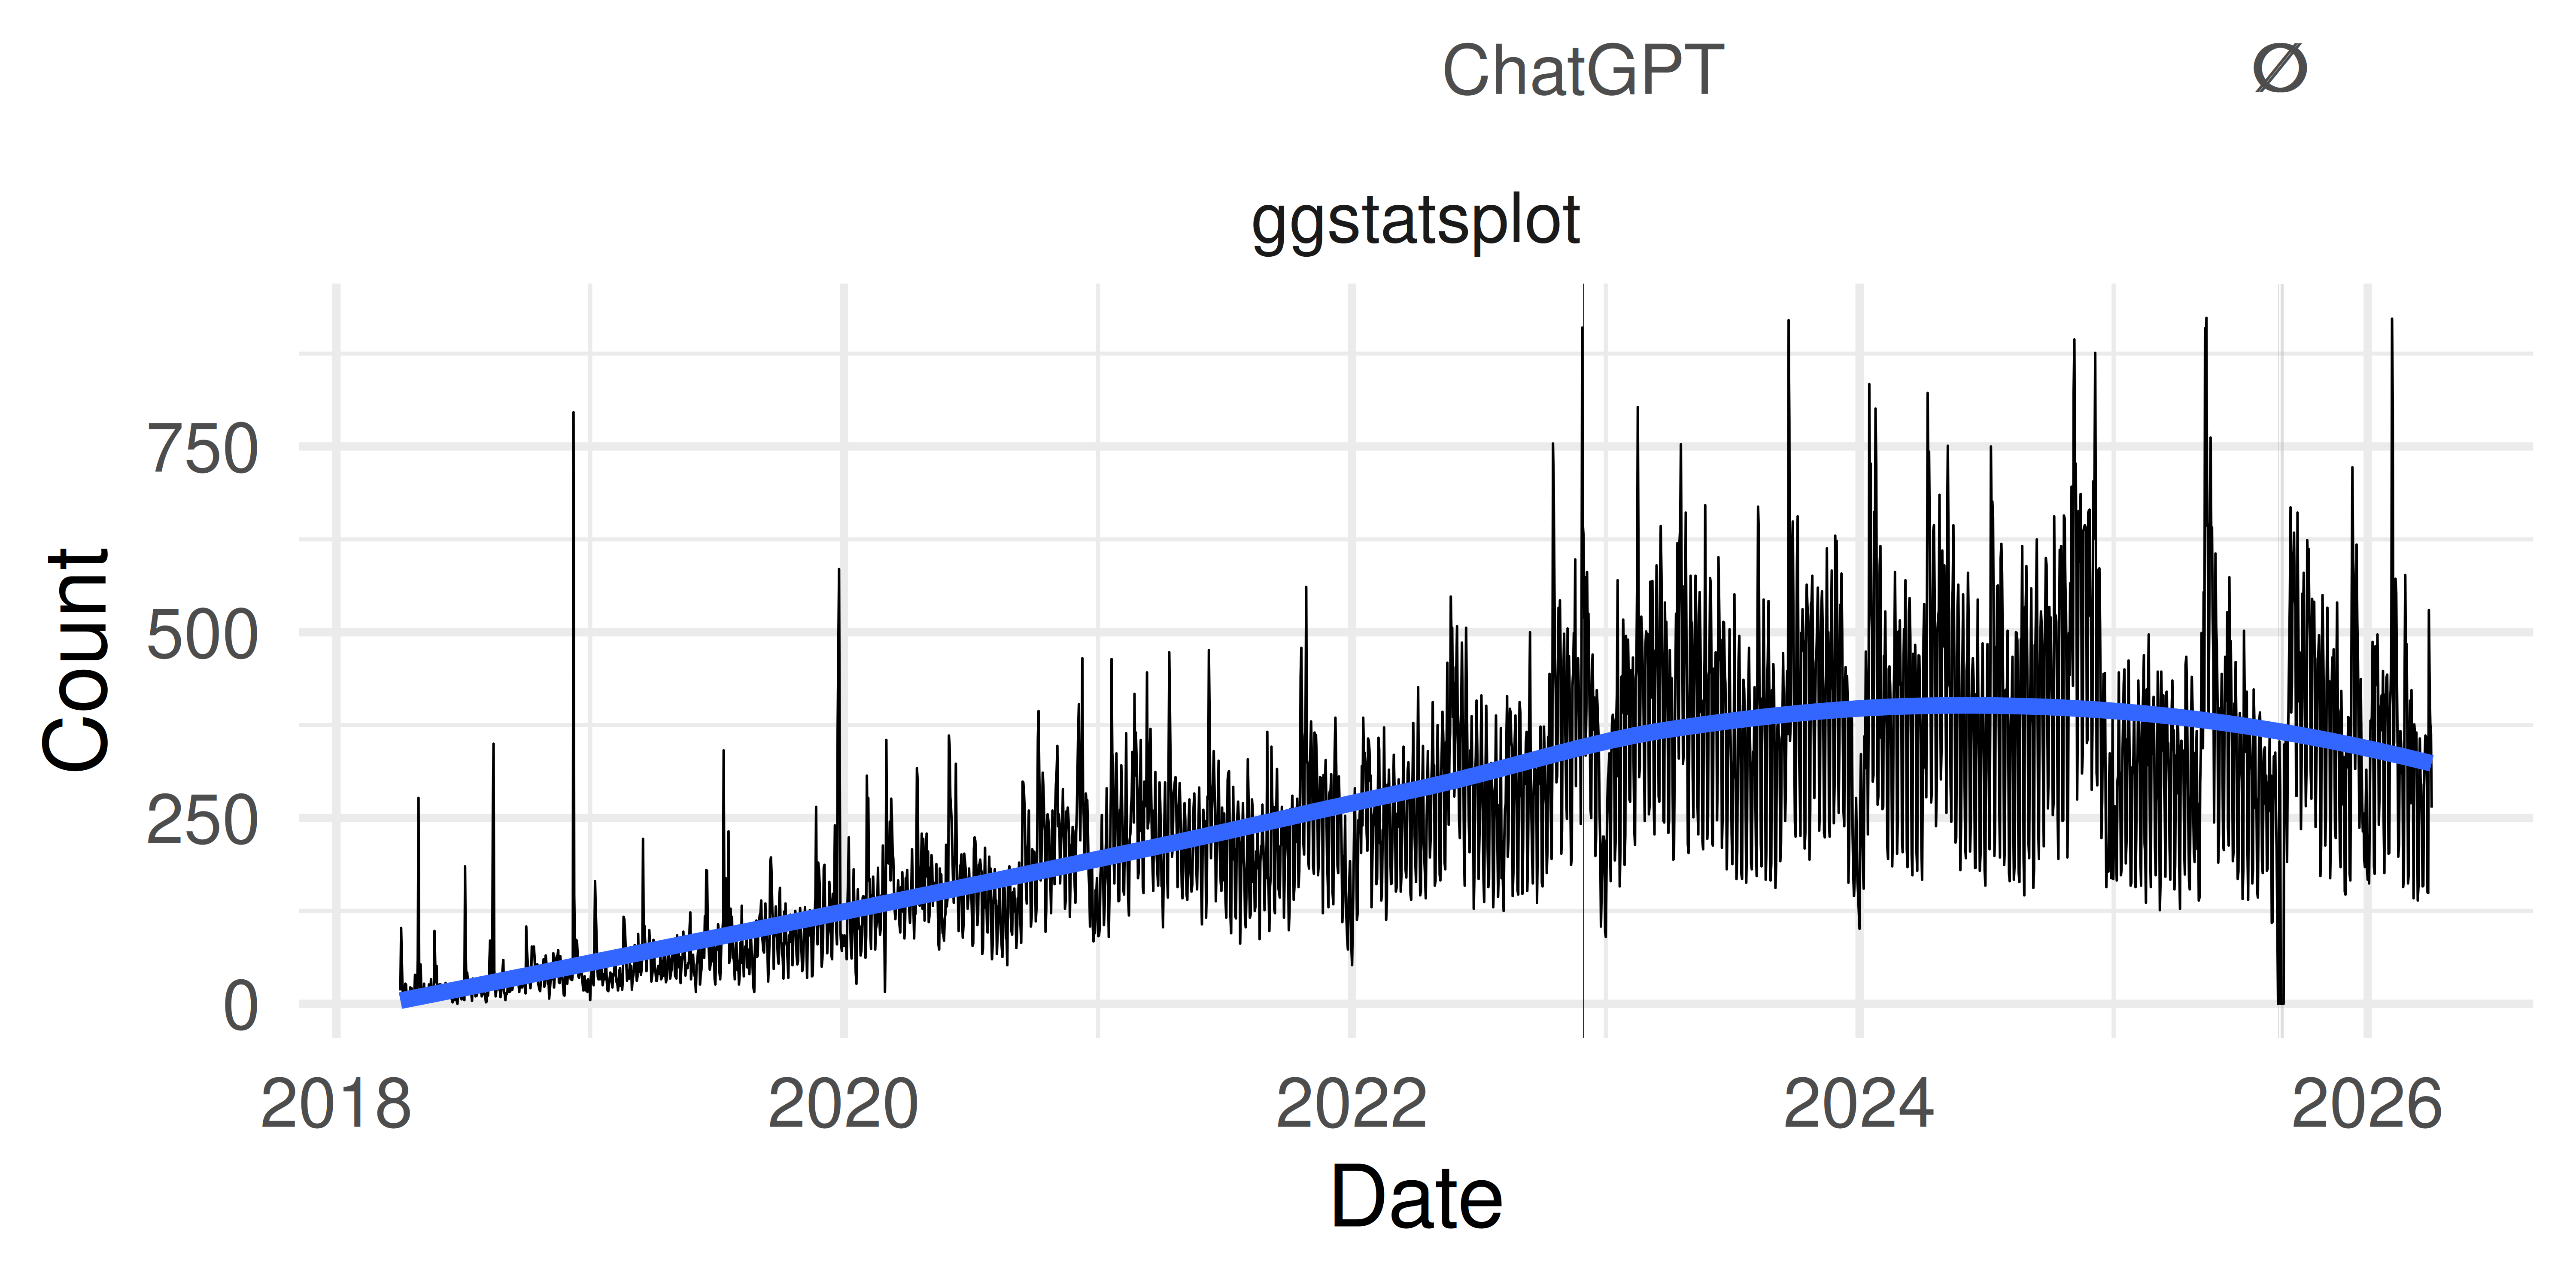
Daily CRAN downloads of ggstatsplot since April 2018, with a smoothed trend.

Second most starred ggplot2-extension!

GitHub repository card for ggstatsplot showing about two thousand stars and 190 forks in the captured snapshot.

Total citations > 1400

From publications across a wide range of fields:
biology, medicine, psychology, economics, etc.
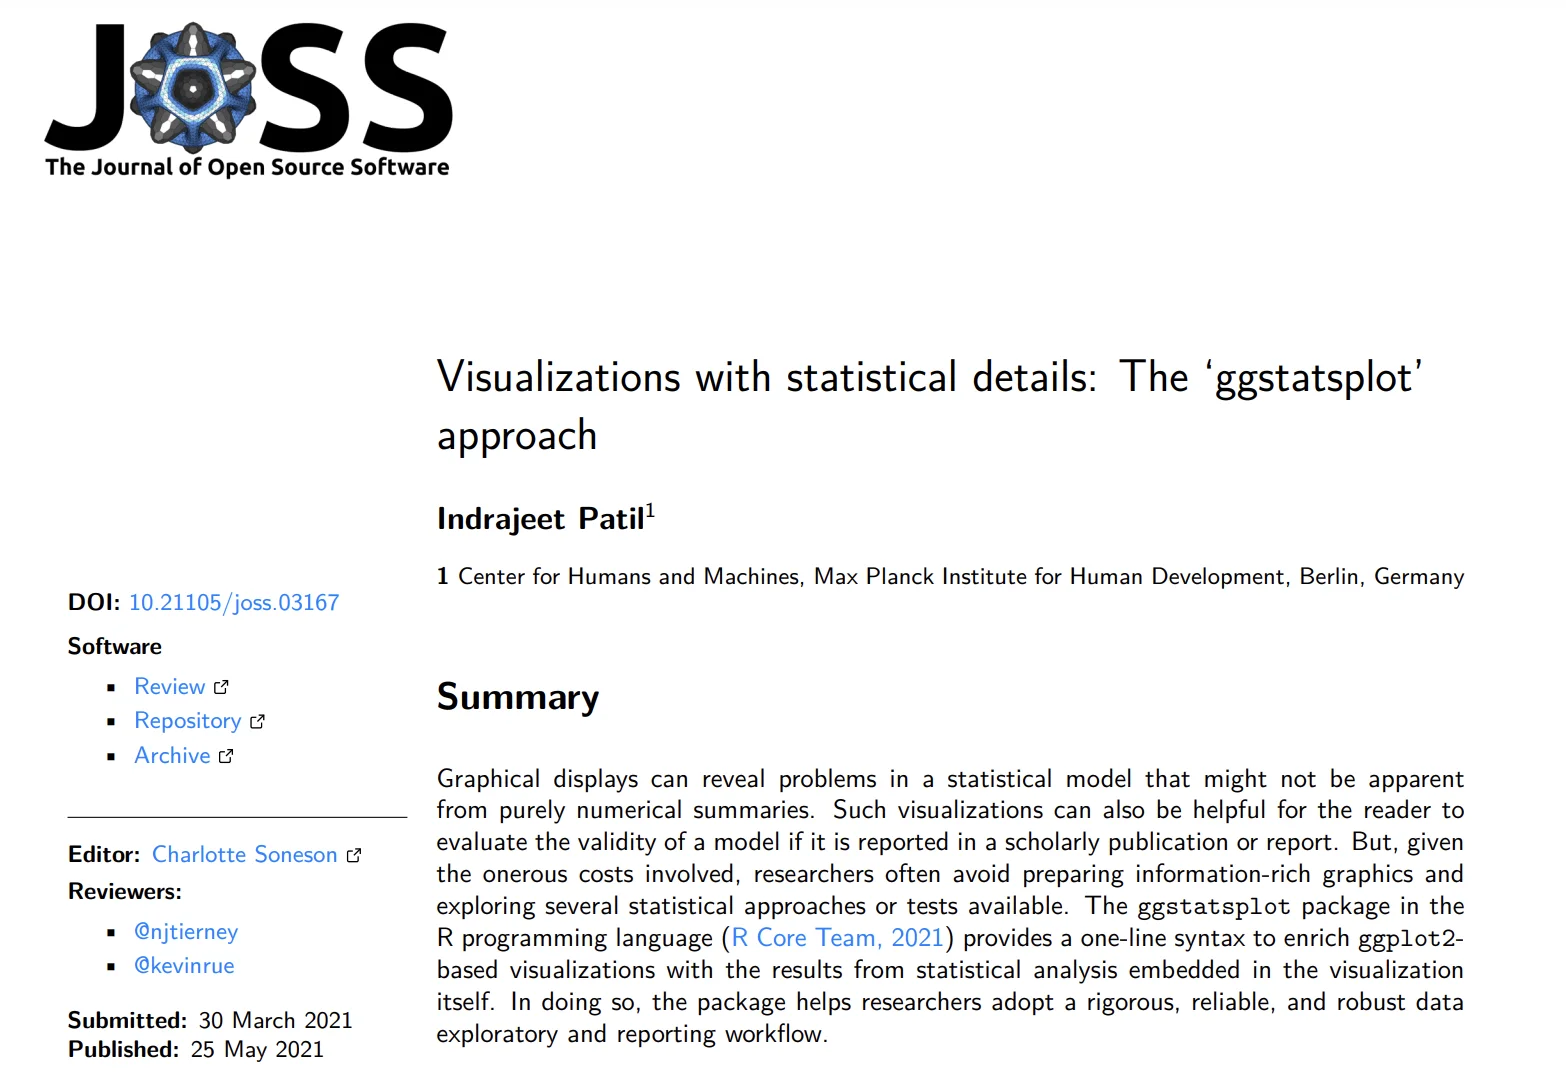
First page of the Journal of Open Source Software article Visualizations with statistical details: The ggstatsplot approach by Indrajeet Patil.


Pleasant Side Effects

Maybe the real treasure was the skills we acquired along the way!

Software Architecture

Breaking down the monolith: \(20K_{(2017)} \rightarrow 1K_{(2024)}\) lines of code

flowchart LR
    ggstatsplot[ggstatsplot]
    statsExpressions[statsExpressions]
    note["backend engine"]
    
    subgraph easystats[easystats]
        effectsize[effectsize]
        insight[insight]
        parameters[parameters]
        performance[performance]
        bayestestR[bayestestR]
    end
    
    %% Main dependencies
    ggstatsplot --> statsExpressions
    ggstatsplot --> dots[Other dependencies]
    
    %% Add note connecting to the main relationship
    note -.-> statsExpressions
    
    %% statsExpressions dependencies on easystats packages
    statsExpressions --> effectsize
    statsExpressions --> insight
    statsExpressions --> parameters
    statsExpressions --> performance
    statsExpressions --> bayestestR
    
    %% Styling using custom colors
    style easystats fill:#EED3B1
    
    classDef main fill:#FCF596,stroke:#333,stroke-width:3px
    classDef note fill:#ffffff,stroke:#333,stroke-width:1px,stroke-dasharray: 5 5
    
    class ggstatsplot main
    class note note

Collaborative Solutions

While re-architecting ggstatsplot, I started contributing upstream.

As part of easystats core team

  • leadership skills to steer the project
  • long-term vision for the project
  • API design
  • CI infrastructure
  • code review
  • documentation
  • scouting for new talent
  • developer advocacy
  • community engagement

Logos of the easystats packages, including insight, parameters, performance, effectsize, bayestestR, correlation, see, report, modelbased, and datawizard.

Making it a habit

  • co-author of lintr (linter for R)
  • co-author of styler (code formatter)

Quality Assurance

“The only way to go fast, is to go well.”
- Robert C. Martin

CI Checks (GitHub Actions)

  • Unit tests (random-order)
  • Code coverage (100%)
  • Linting (0 lints)
  • Formatting (0 issues)
  • Documentation (website, no link rot, plenty examples)
  • Pre-commit hooks (0 issues)
  • Zero user-facing warnings
  • Portability (Linux, macOS, Windows)
  • Robustness (dependencies, language versions)
  • CRAN checks (0 notes, 0 warnings, 0 errors)

Healthy and active code base
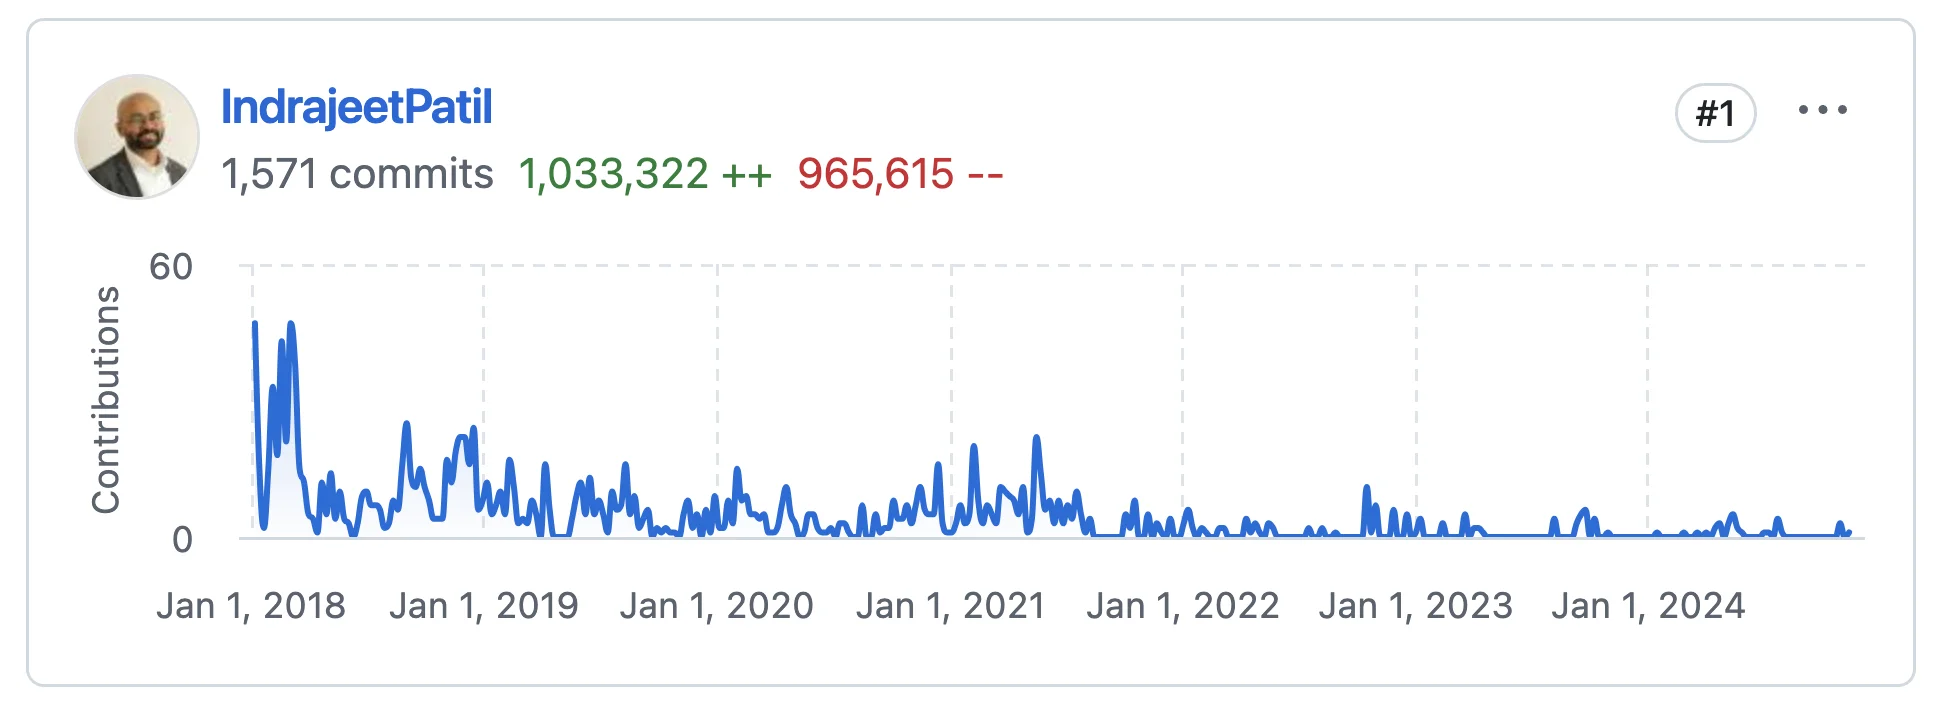
GitHub contribution chart showing sustained development of ggstatsplot from 2018 through 2024.

GitHub pull request status reporting that all 24 checks have passed.

Communication

Training material on best practices in software/package development to support community contributions keeping in mind the diverse backgrounds of contributors.
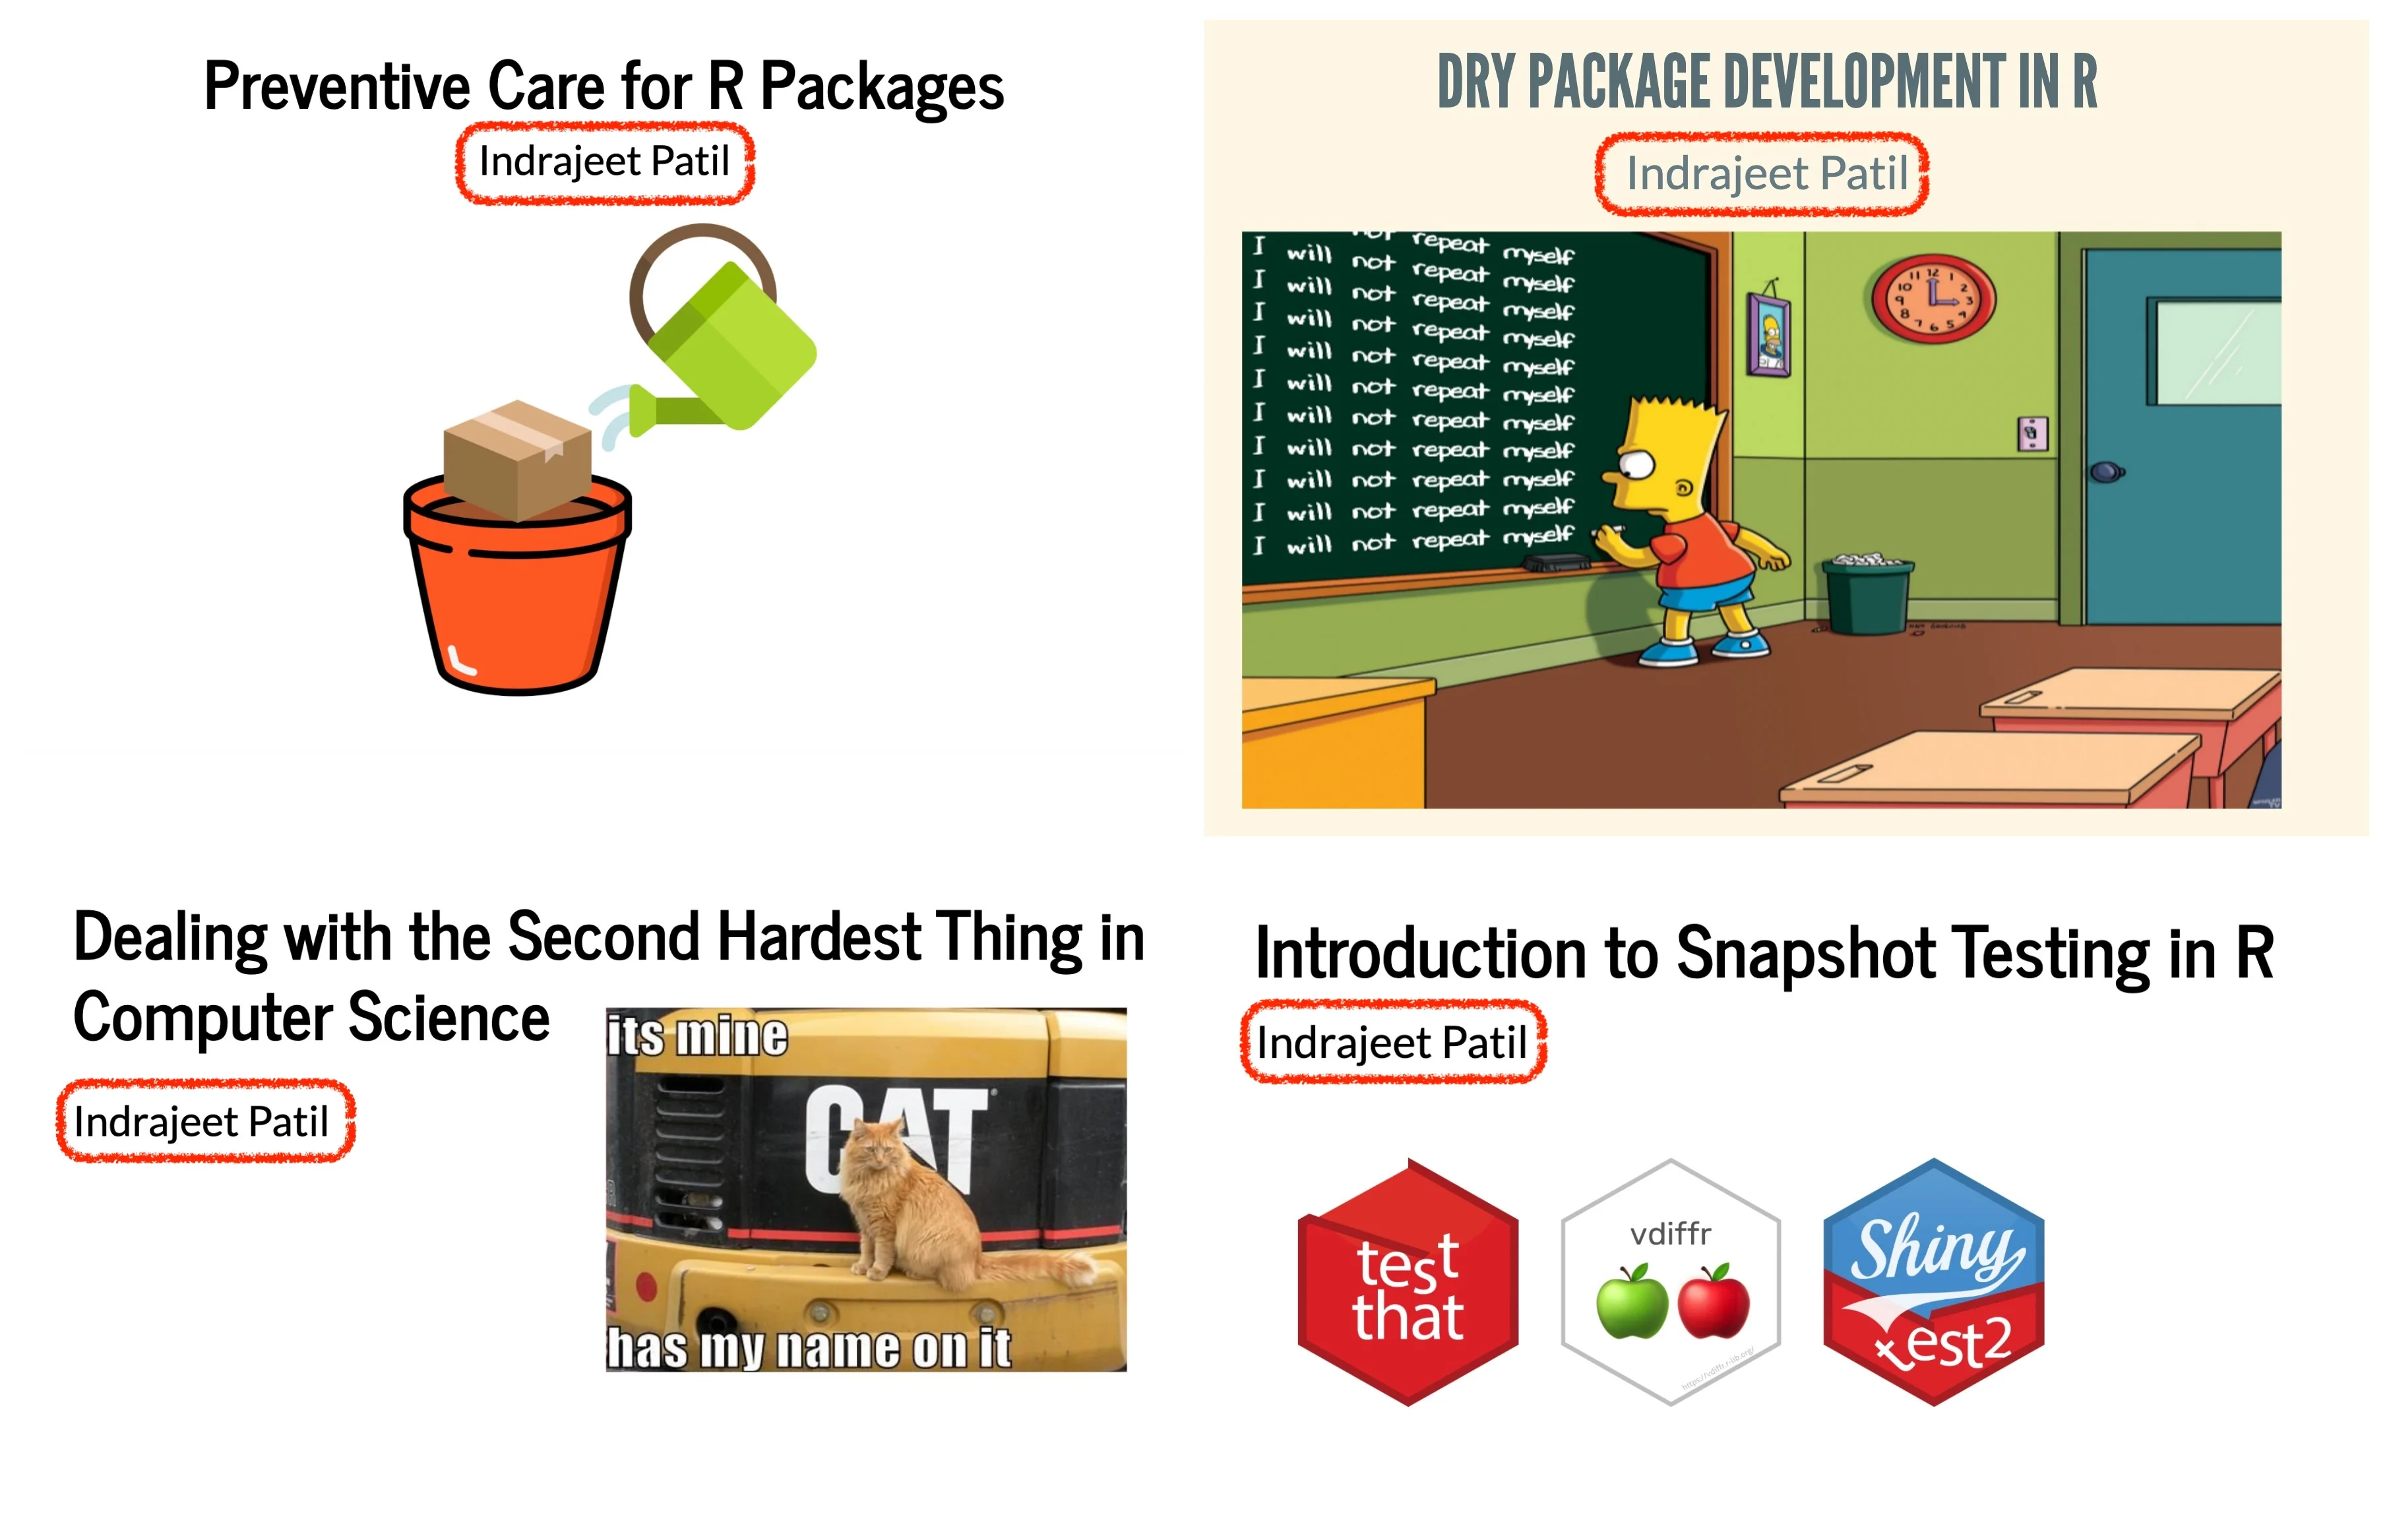
Four training decks cover preventive care, DRY development, naming, and snapshot testing for R packages.

Biography (2017-)

(Or how developing ggstatsplot continues to help me grow as a software developer)

graph LR
    Project[ggstatsplot]

    %% Technical Skills Branch
    Project --> TechSkills[Technical Skills]
    TechSkills --> CodeQuality[Code Quality]
    TechSkills --> ArchDesign[Architecture Design]
    TechSkills --> TechDebt[Technical Debt]

    %% Soft Skills Branch
    Project --> SoftSkills[Soft Skills]
    SoftSkills --> Collab[Collaboration]
    SoftSkills --> Leadership[Leadership]
    SoftSkills --> Communication[Communication]

    %% Styling using colorblind-friendly palette
    classDef mainNode fill:#FCF596,stroke:#000000,stroke-width:3px
    classDef broardSkillNode fill:#D0E8C5,stroke:#333,stroke-width:1px
    classDef skillNode fill:#ffffff,stroke:#333,stroke-width:1px,stroke-dasharray: 5 5

    class Project mainNode
    class TechSkills,SoftSkills broardSkillNode
    class CodeQuality,ArchDesign,TechDebt,Collab,Leadership,Communication skillNode

Conclusion

ggstatsplot offers an intuitive interface for creating detailed statistical visualizations, enabling users to adopt rigorous, reliable, and robust workflows for data exploration and reporting across various academic and industrial disciplines. It is a well-maintained tool with high-quality infrastructure and widespread adoption.

Thank You 😊

Happy visualizing and reporting!


Check out my other slide decks on software development best practices


Session information

sessioninfo::session_info(include_base = TRUE)
─ Session info ───────────────────────────────────────────────────────────────
 setting  value
 version  R version 4.6.1 (2026-06-24)
 os       Ubuntu 24.04.5 LTS
 system   x86_64, linux-gnu
 ui       X11
 language (EN)
 collate  C.UTF-8
 ctype    C.UTF-8
 tz       UTC
 date     2026-09-27
 pandoc   3.11 @ /opt/hostedtoolcache/pandoc/3.11/x64/ (via rmarkdown)
 quarto   1.10.18 @ /usr/local/bin/quarto

─ Packages ───────────────────────────────────────────────────────────────────
 package          * version    date (UTC) lib source
 base             * 4.6.1      2026-06-24 [3] local
 BayesFactor        0.9.12-4.8 2026-03-07 [1] RSPM
 bayestestR         0.19.0     2026-09-09 [1] RSPM
 bitops             1.1-0      2026-07-30 [1] RSPM
 boot               1.3-32     2025-08-29 [3] CRAN (R 4.6.1)
 BWStest            0.2.3      2023-10-10 [1] RSPM
 cachem             1.1.0      2024-05-16 [1] RSPM
 cli                3.6.6      2026-04-09 [1] RSPM
 coda               0.19-4.1   2024-01-31 [1] RSPM
 compiler           4.6.1      2026-06-24 [3] local
 correlation        0.8.8      2025-07-08 [1] RSPM
 cranlogs           2.1.1      2019-04-29 [1] RSPM
 curl               8.0.0      2026-08-25 [1] RSPM
 data.table         1.18.6.1   2026-08-24 [1] RSPM
 datasets         * 4.6.1      2026-06-24 [3] local
 datawizard         1.4.0      2026-09-10 [1] RSPM
 digest             0.6.39     2025-11-19 [1] RSPM
 dplyr              1.2.1      2026-04-03 [1] RSPM
 effectsize         1.0.3      2026-07-07 [1] RSPM
 evaluate           1.0.5      2025-08-27 [1] RSPM
 farver             2.1.2      2024-05-13 [1] RSPM
 fastmap            1.2.0      2024-05-15 [1] RSPM
 fasttime           1.1-0      2022-03-16 [1] RSPM
 generics           0.1.4      2025-05-09 [1] RSPM
 ggplot2          * 4.0.3      2026-04-22 [1] RSPM
 ggrepel            0.9.8      2026-03-17 [1] RSPM
 ggsignif           0.6.4      2022-10-13 [1] RSPM
 ggstatsplot      * 1.1.1      2026-08-25 [1] RSPM
 glue               1.8.1      2026-04-17 [1] RSPM
 gmp                0.7-5.1    2026-02-09 [1] RSPM
 graphics         * 4.6.1      2026-06-24 [3] local
 grDevices        * 4.6.1      2026-06-24 [3] local
 grid               4.6.1      2026-06-24 [3] local
 gtable             0.3.6      2024-10-25 [1] RSPM
 htmltools          0.5.9      2025-12-04 [1] RSPM
 httr               1.4.9      2026-09-01 [1] RSPM
 insight            1.5.4      2026-09-05 [1] RSPM
 jsonlite           2.0.0      2025-03-27 [1] RSPM
 knitr              1.52       2026-09-06 [1] RSPM
 kSamples           1.2-12     2025-08-26 [1] RSPM
 labeling           0.4.3      2023-08-29 [1] RSPM
 lattice            0.23-1     2026-08-12 [1] RSPM
 lifecycle          1.0.5      2026-01-08 [1] RSPM
 lubridate          1.9.5      2026-02-04 [1] RSPM
 magrittr         * 2.0.5      2026-04-04 [1] RSPM
 MASS               7.3-66     2026-07-15 [1] RSPM
 Matrix             1.7-6      2026-07-25 [1] RSPM
 MatrixModels       0.5-4      2025-03-26 [1] RSPM
 memoise            2.0.1      2021-11-26 [1] RSPM
 methods          * 4.6.1      2026-06-24 [3] local
 mgcv               1.9-4      2025-11-07 [3] CRAN (R 4.6.1)
 multcompView       0.1-12     2026-07-26 [1] RSPM
 mvtnorm            1.4-2      2026-07-12 [1] RSPM
 nlme               3.1-171    2026-09-01 [1] RSPM
 otel               0.2.0      2025-08-29 [1] RSPM
 packageRank      * 0.9.9      2026-09-23 [1] RSPM
 paletteer          1.7.0      2026-01-08 [1] RSPM
 parallel           4.6.1      2026-06-24 [3] local
 parameters         0.29.3     2026-09-02 [1] RSPM
 patchwork          1.3.2      2025-08-25 [1] RSPM
 pbapply            1.7-5      2026-09-01 [1] RSPM
 performance        0.18.2     2026-09-10 [1] RSPM
 pillar             1.11.1     2025-09-17 [1] RSPM
 pkgconfig          2.0.3      2019-09-22 [1] RSPM
 pkgsearch          3.1.5      2025-04-12 [1] RSPM
 PMCMRplus          1.9.12     2024-09-08 [1] RSPM
 prismatic          1.1.2      2024-04-10 [1] RSPM
 purrr              1.2.2      2026-04-10 [1] RSPM
 R.methodsS3        1.8.2      2022-06-13 [1] RSPM
 R.oo               1.27.1     2025-05-02 [1] RSPM
 R.utils            2.13.0     2025-02-24 [1] RSPM
 R6                 2.6.1      2025-02-15 [1] RSPM
 RColorBrewer       1.1-3      2022-04-03 [1] RSPM
 Rcpp               1.1.2      2026-07-05 [1] RSPM
 RcppParallel       6.2.1      2026-08-27 [1] RSPM
 RCurl              1.98-1.20  2026-08-21 [1] RSPM
 rematch2           2.1.2      2020-05-01 [1] RSPM
 rlang              1.3.0      2026-07-05 [1] RSPM
 rmarkdown          2.32       2026-09-01 [1] RSPM
 Rmpfr              1.1-3      2026-09-06 [1] RSPM
 rstantools         2.7.1      2026-08-29 [1] RSPM
 S7                 0.2.2      2026-04-22 [1] RSPM
 scales             1.4.0      2025-04-24 [1] RSPM
 sessioninfo        1.2.4      2026-06-04 [1] any (@1.2.4)
 splines            4.6.1      2026-06-24 [3] local
 stats            * 4.6.1      2026-06-24 [3] local
 statsExpressions   2.1.1      2026-08-24 [1] RSPM
 stringi            1.8.9      2026-08-04 [1] RSPM
 stringr            1.6.0      2025-11-04 [1] RSPM
 sugrrants          0.2.9      2024-03-12 [1] RSPM
 SuppDists          1.1-9.9    2025-03-24 [1] RSPM
 tibble             3.3.1      2026-01-11 [1] RSPM
 tidyr              1.3.2      2025-12-19 [1] RSPM
 tidyselect         1.2.1      2024-03-11 [1] RSPM
 timechange         0.4.0      2026-01-29 [1] RSPM
 tools              4.6.1      2026-06-24 [3] local
 utils            * 4.6.1      2026-06-24 [3] local
 vctrs              0.7.3      2026-04-11 [1] RSPM
 withr              3.0.3      2026-06-19 [1] RSPM
 xfun               0.61       2026-09-16 [1] RSPM
 yaml               2.3.12     2025-12-10 [1] RSPM

 [1] /home/runner/work/_temp/Library
 [2] /opt/R/4.6.1/lib/R/site-library
 [3] /opt/R/4.6.1/lib/R/library
 * ── Packages attached to the search path.

──────────────────────────────────────────────────────────────────────────────

Appendix

Examples of other functions

ggwithinstats()

Hypothesis about group differences: repeated measures design

ggwithinstats(
  data = WRS2::WineTasting,
  x = Wine,
  y = Taste
)
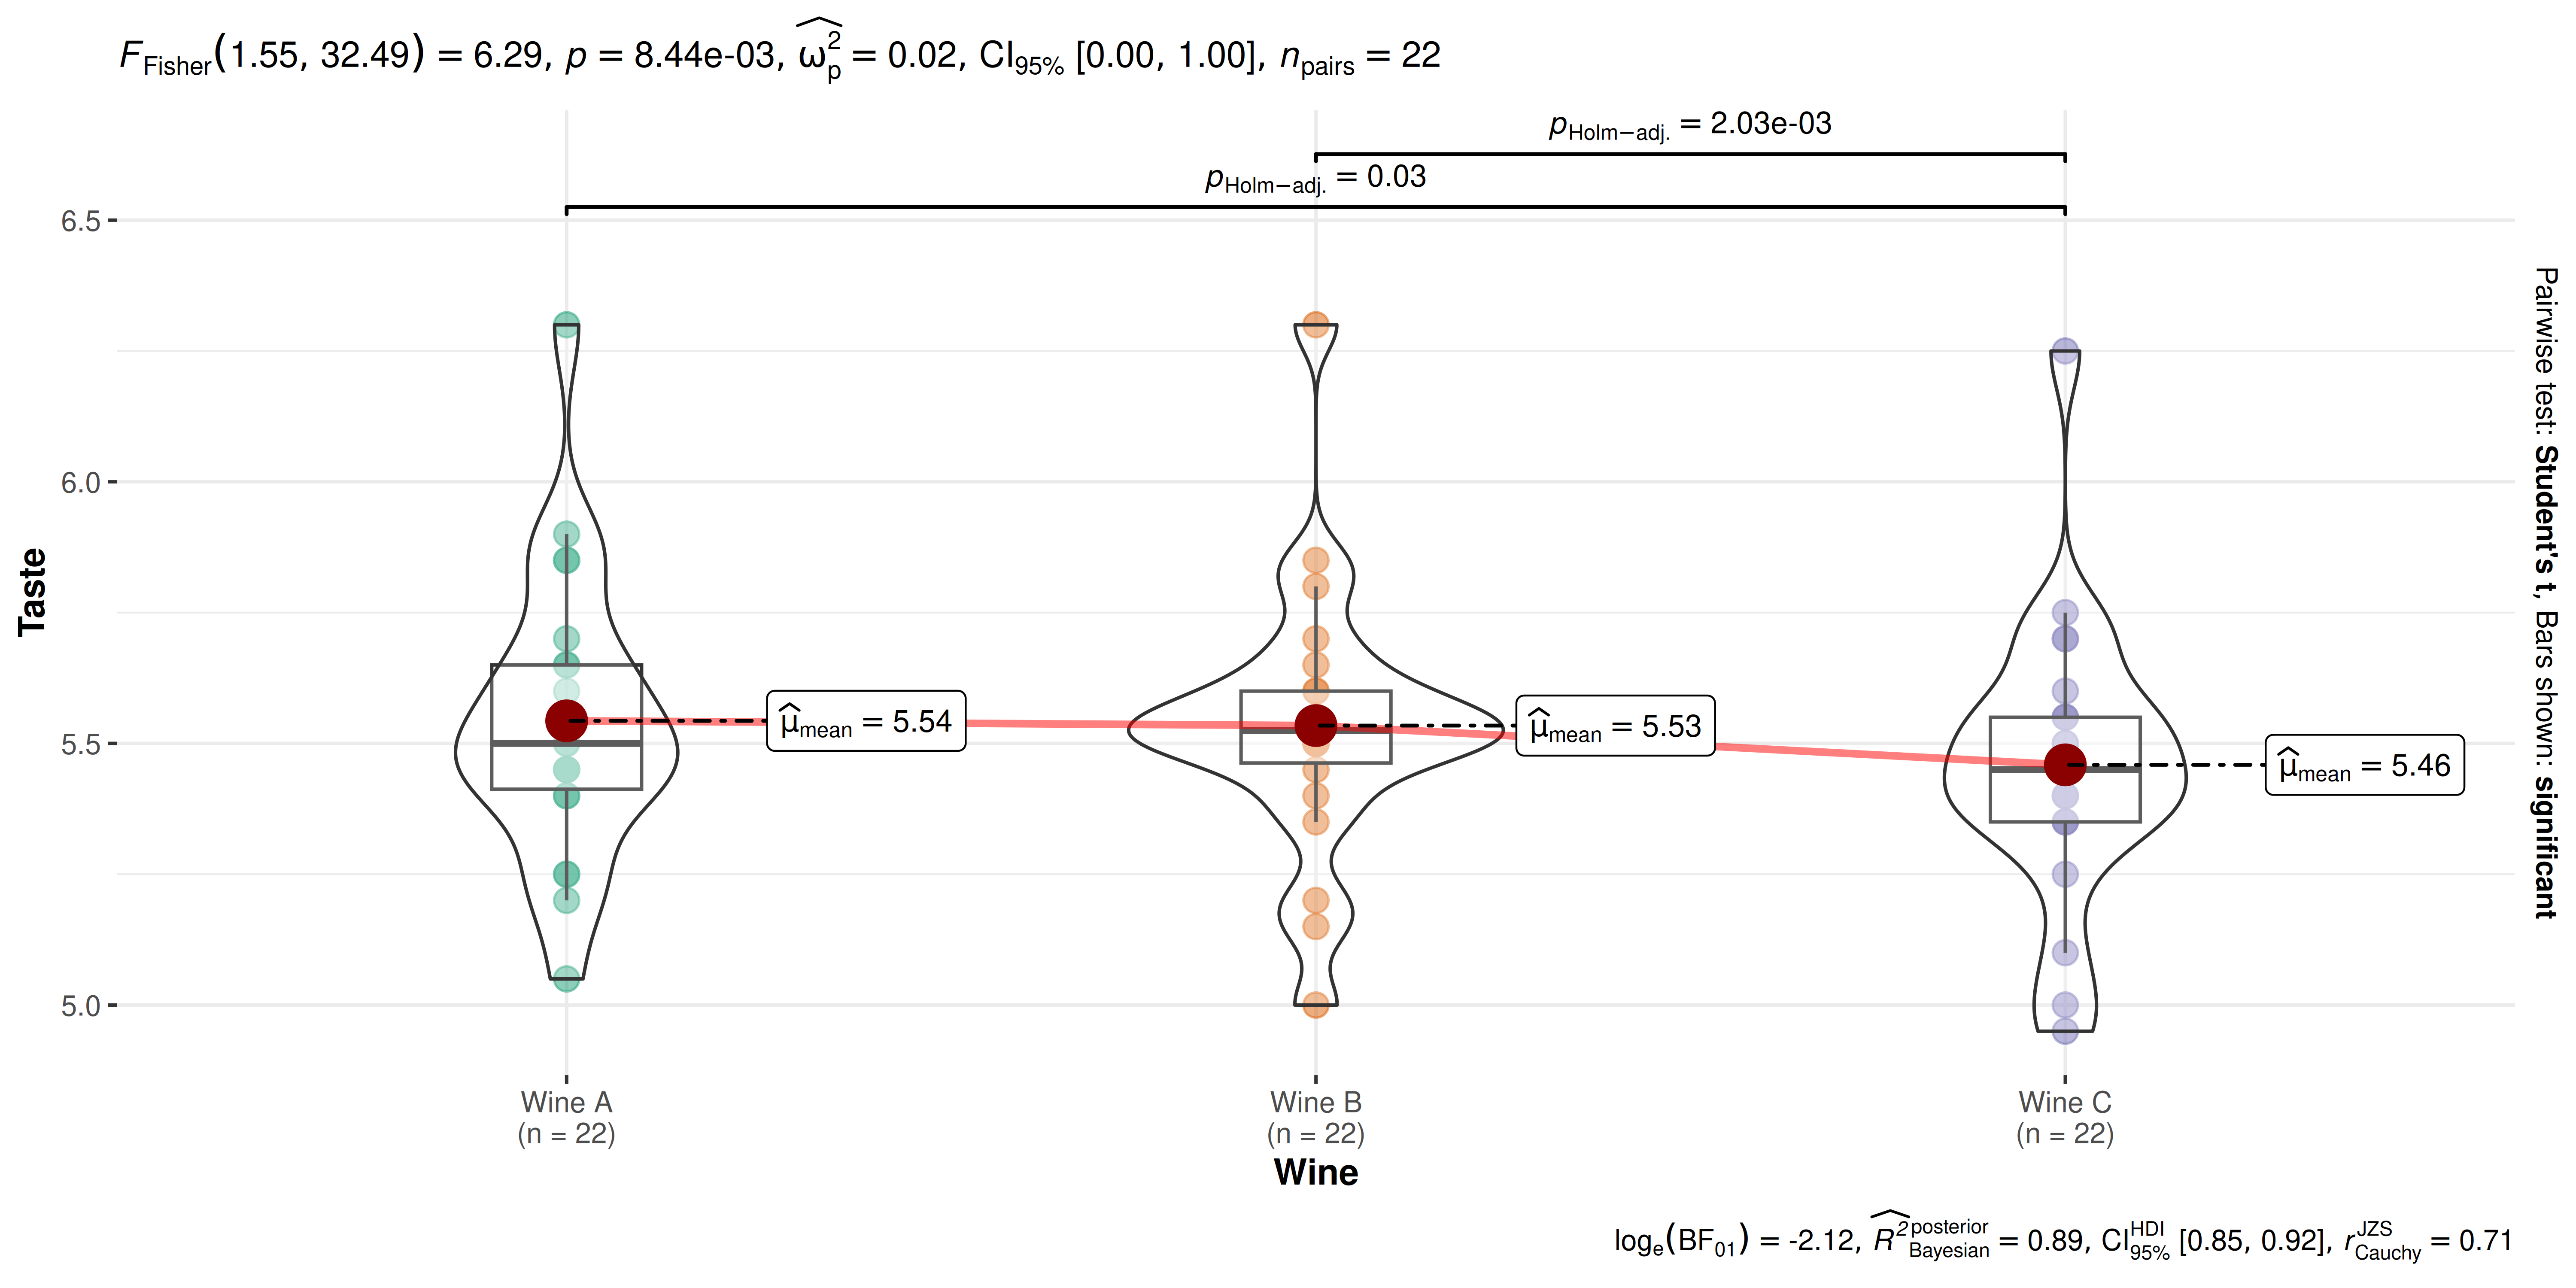
Repeated-measures comparison of wine taste scores across wine types, showing individual observations and statistical summaries.

Important

✏️ Defaults

  • raw data + distributions
  • descriptive statistics
  • inferential statistics
  • effect size + uncertainty
  • pairwise comparisons
  • Bayesian hypothesis-testing
  • Bayesian estimation

Statistical approaches available

  • parametric
  • parametric
  • robust
  • Bayesian

gghistostats()

Distribution of a numeric variable

gghistostats(
  data = movies_long,
  x = budget,
  test.value = 30 
)
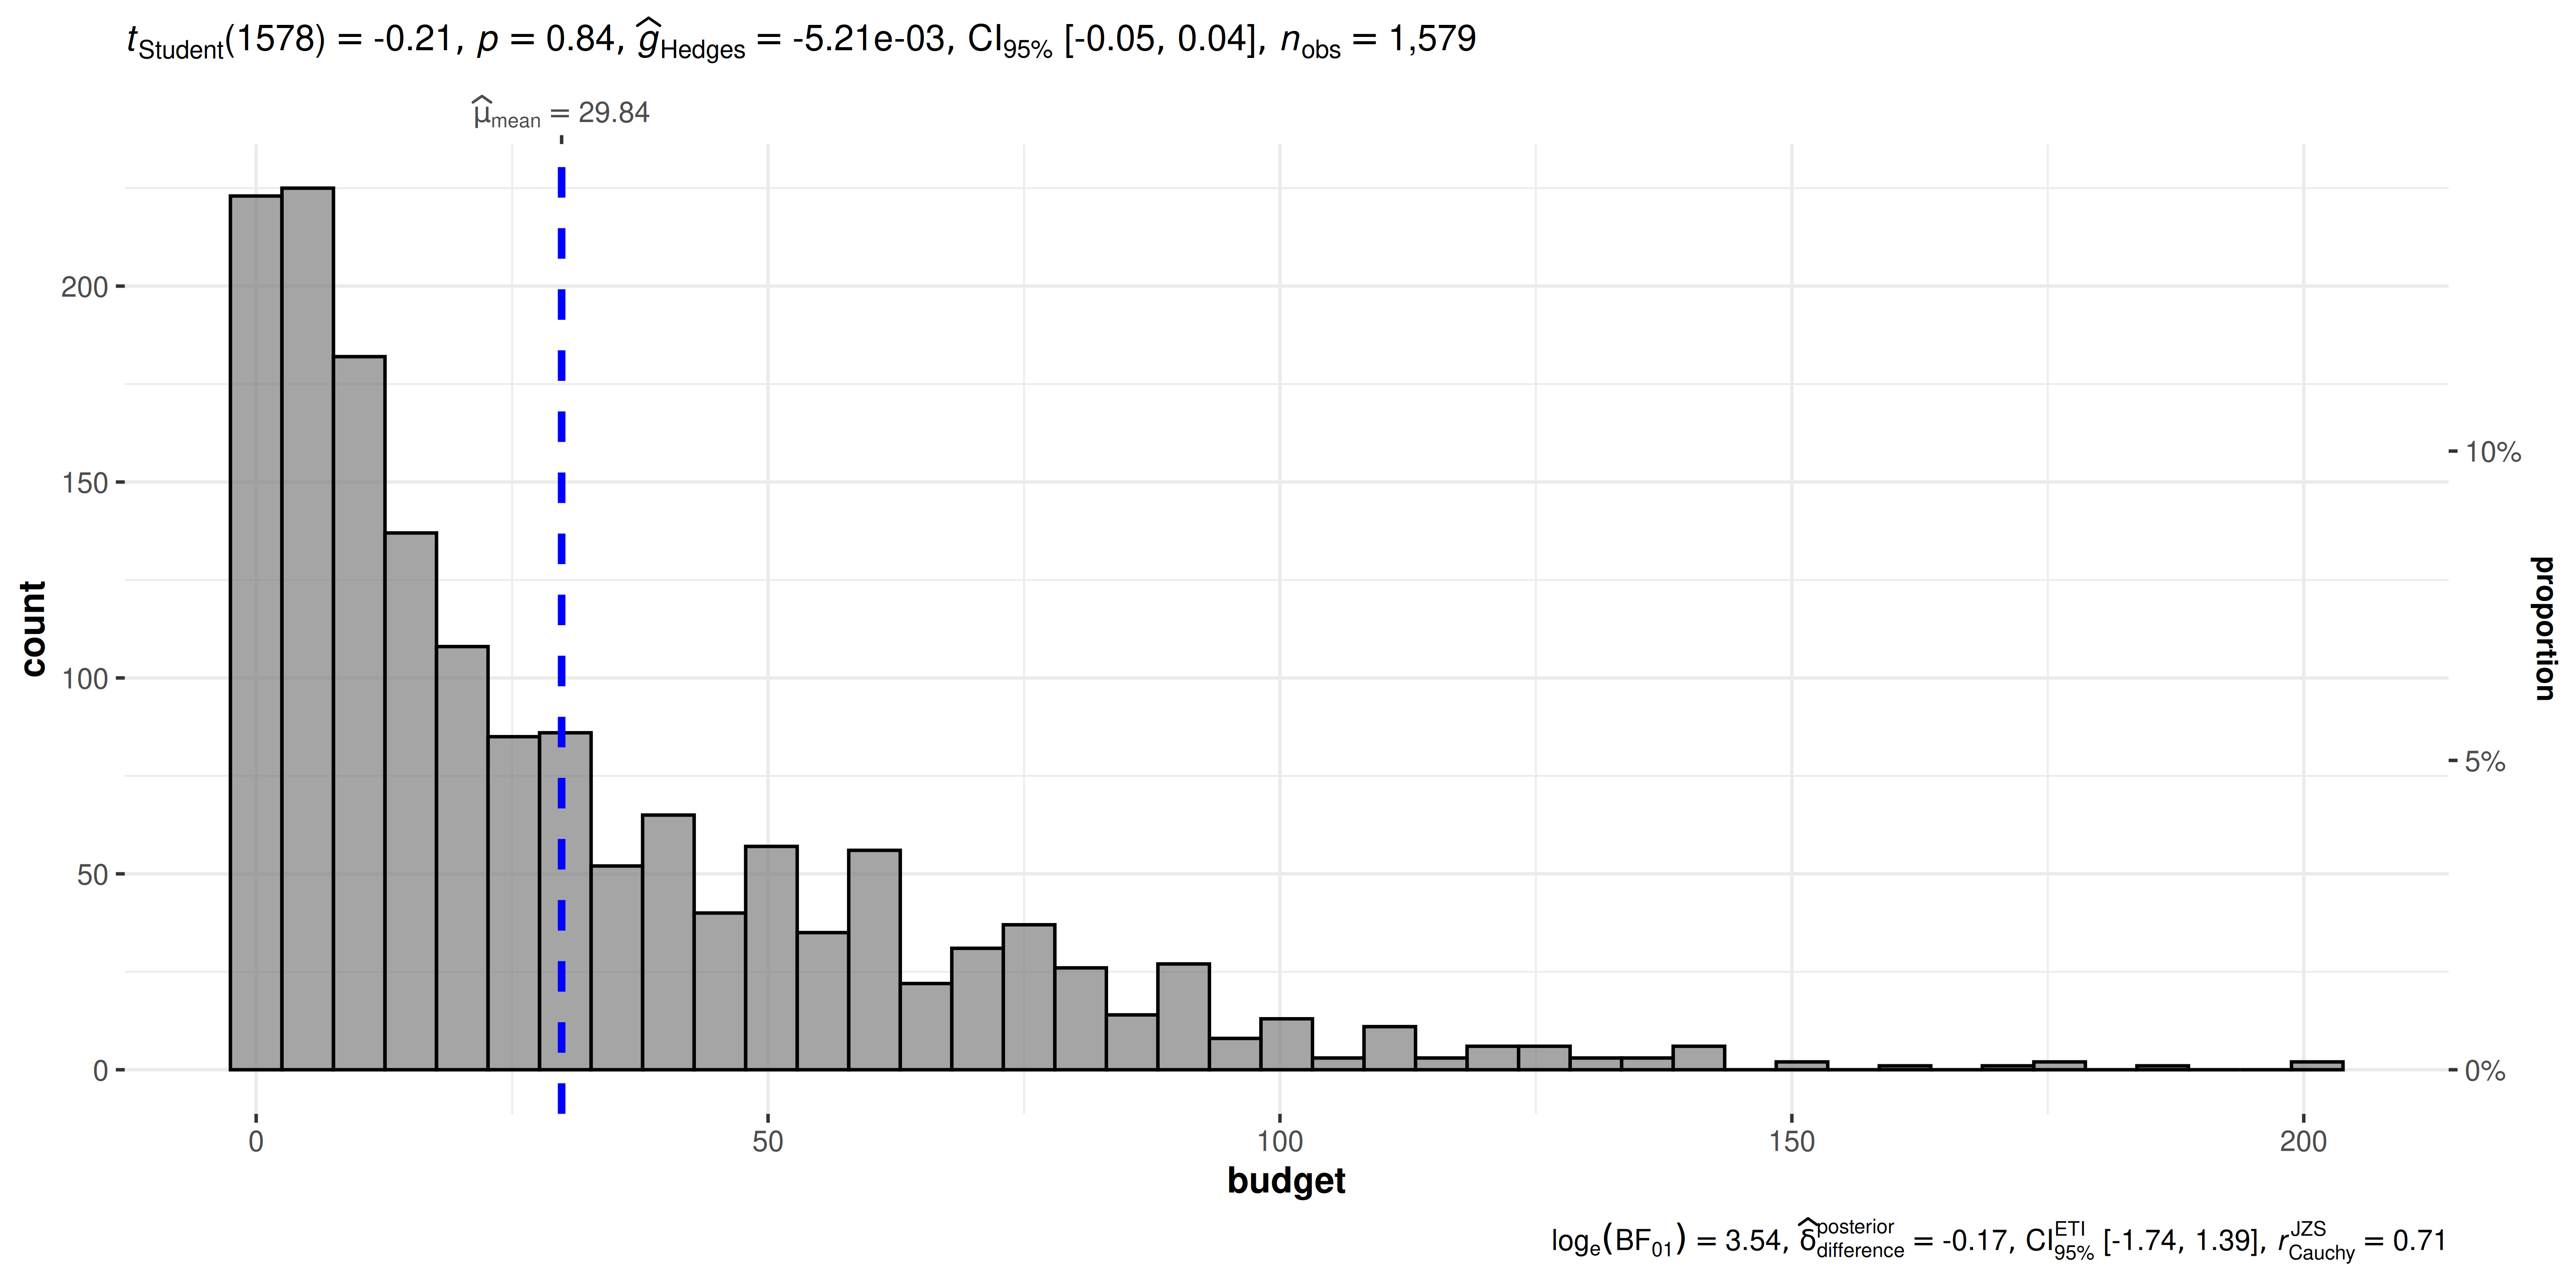
Histogram of movie budgets, with descriptive and inferential statistics comparing the distribution with a reference value of 30.

Important

✏️ Defaults

  • counts + proportion for bins
  • descriptive statistics
  • inferential statistics
  • effect size + uncertainty
  • pairwise comparisons
  • Bayesian hypothesis-testing
  • Bayesian estimation

Statistical approaches available

  • parametric
  • parametric
  • robust
  • Bayesian

ggdotplotstats()

Labeled numeric variable

ggdotplotstats(
  data = movies_long,
  x = budget,
  y = genre,
  test.value = 30 
)
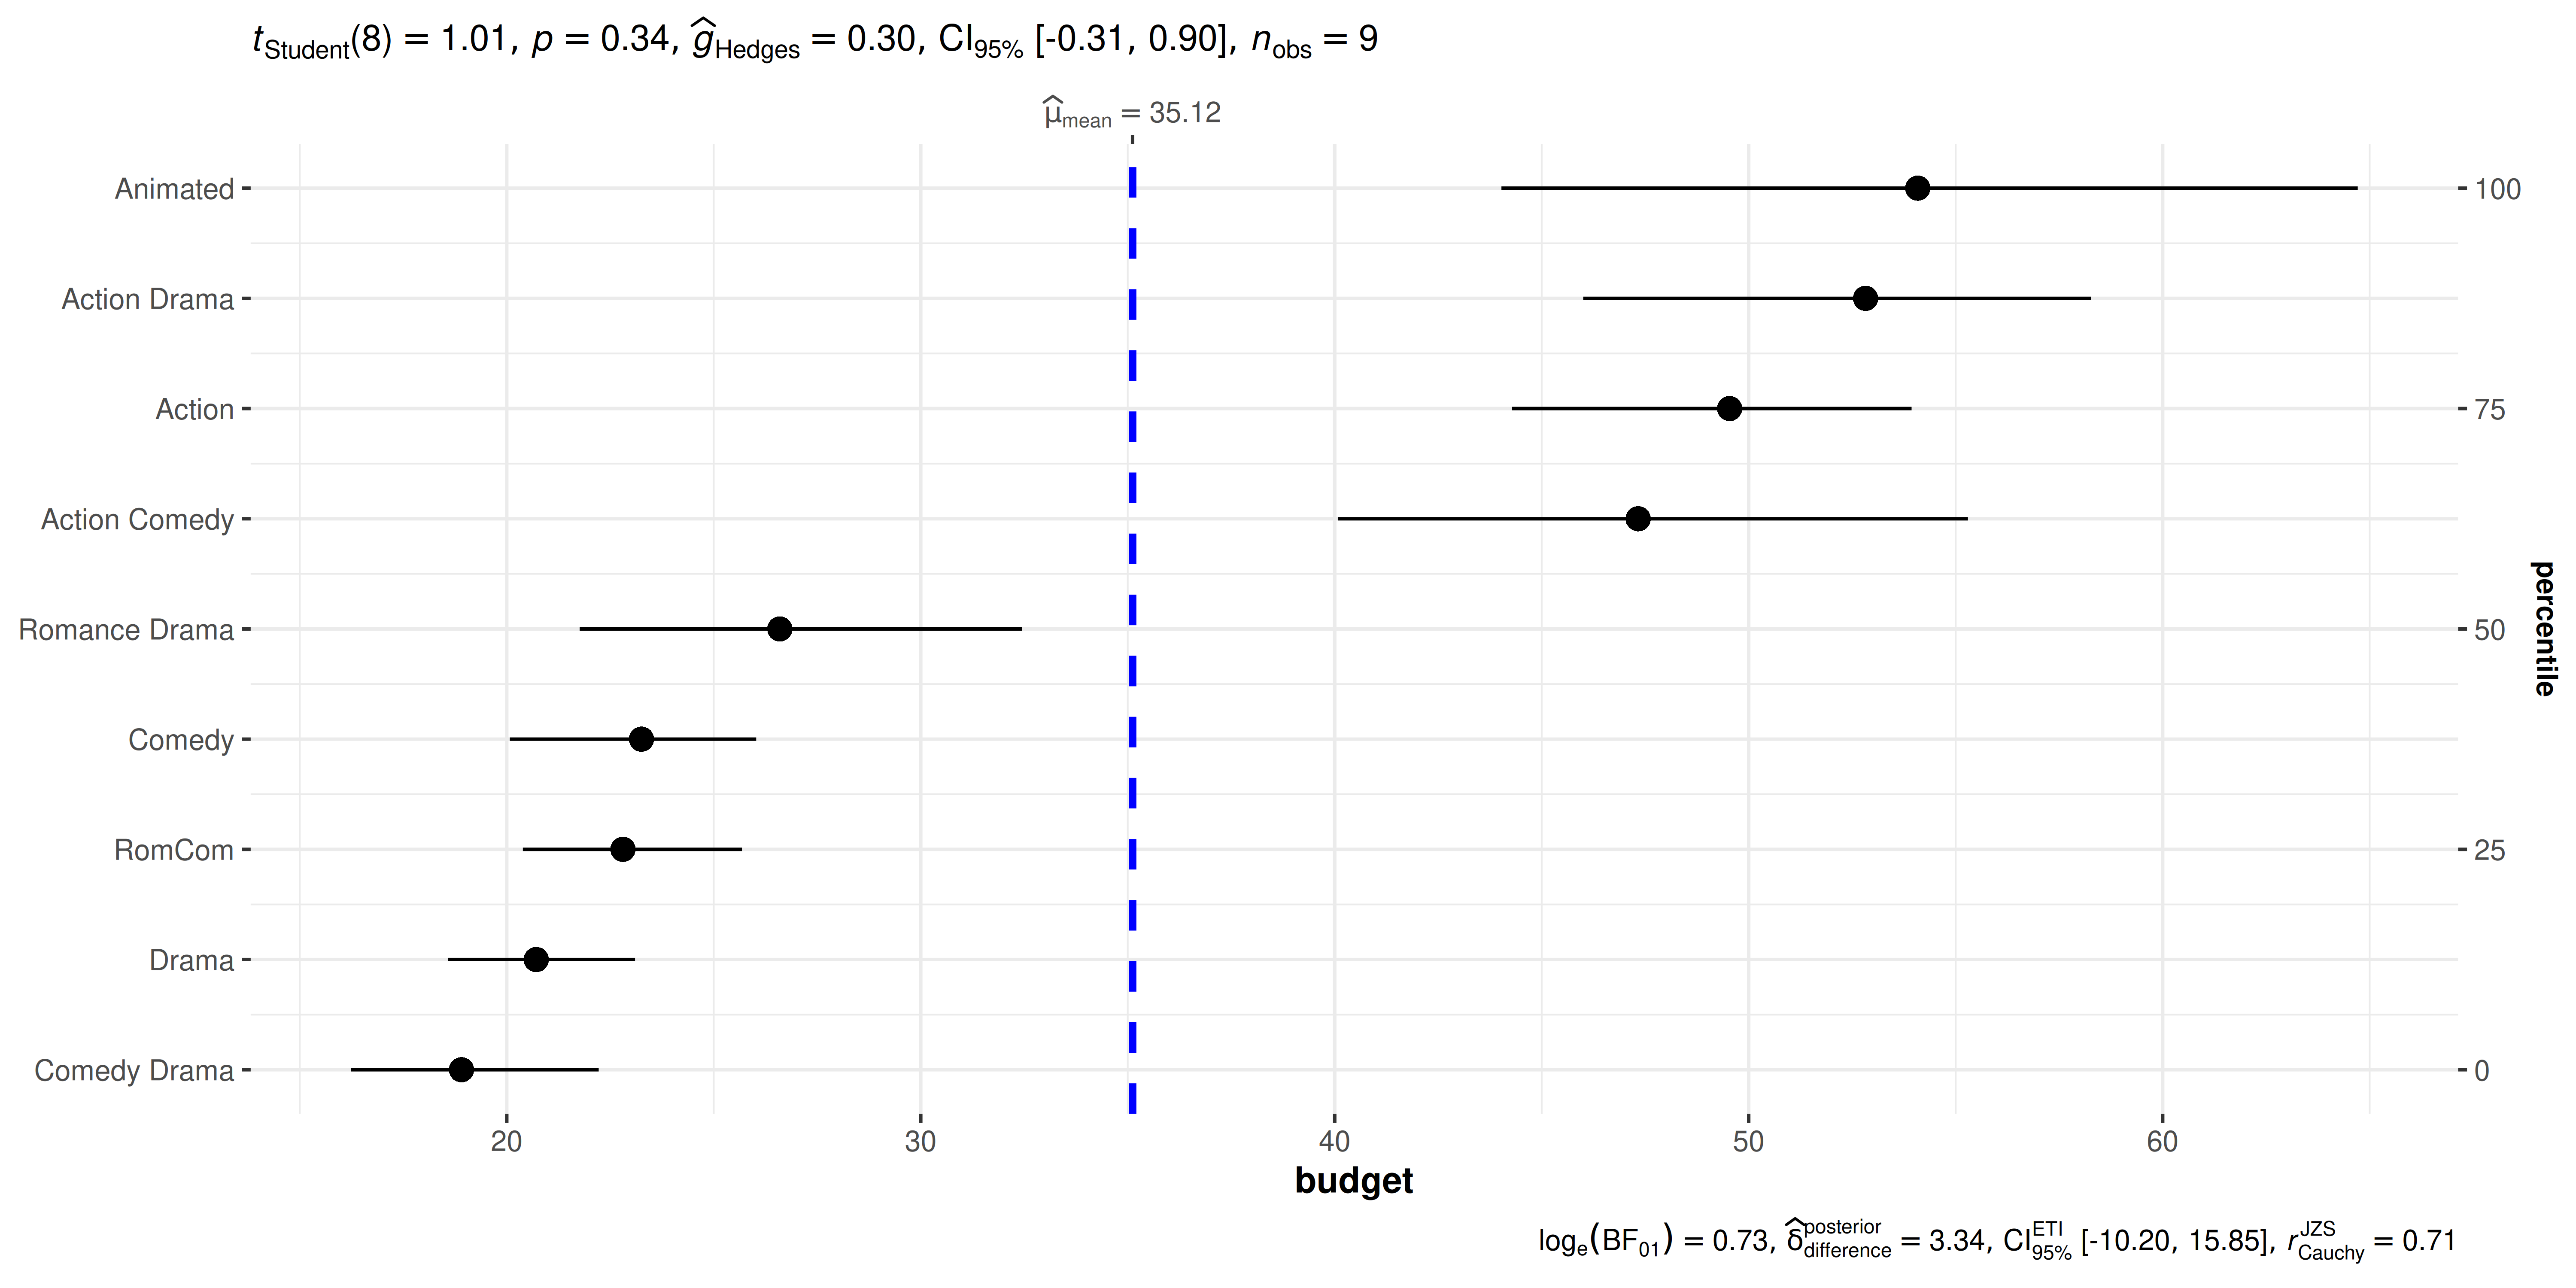
Movie budgets by genre, displayed as a labeled dot plot with statistical summaries and a reference value of 30.

Important

✏️ Defaults

  • descriptive statistics
  • inferential statistics
  • effect size + uncertainty
  • pairwise comparisons
  • Bayesian hypothesis-testing
  • Bayesian estimation

Statistical approaches available

  • parametric
  • parametric
  • robust
  • Bayesian

ggscatterstats()

Hypothesis about correlation: Two numeric variables

ggscatterstats(
  data = movies_long,
  x = budget,
  y = rating
)
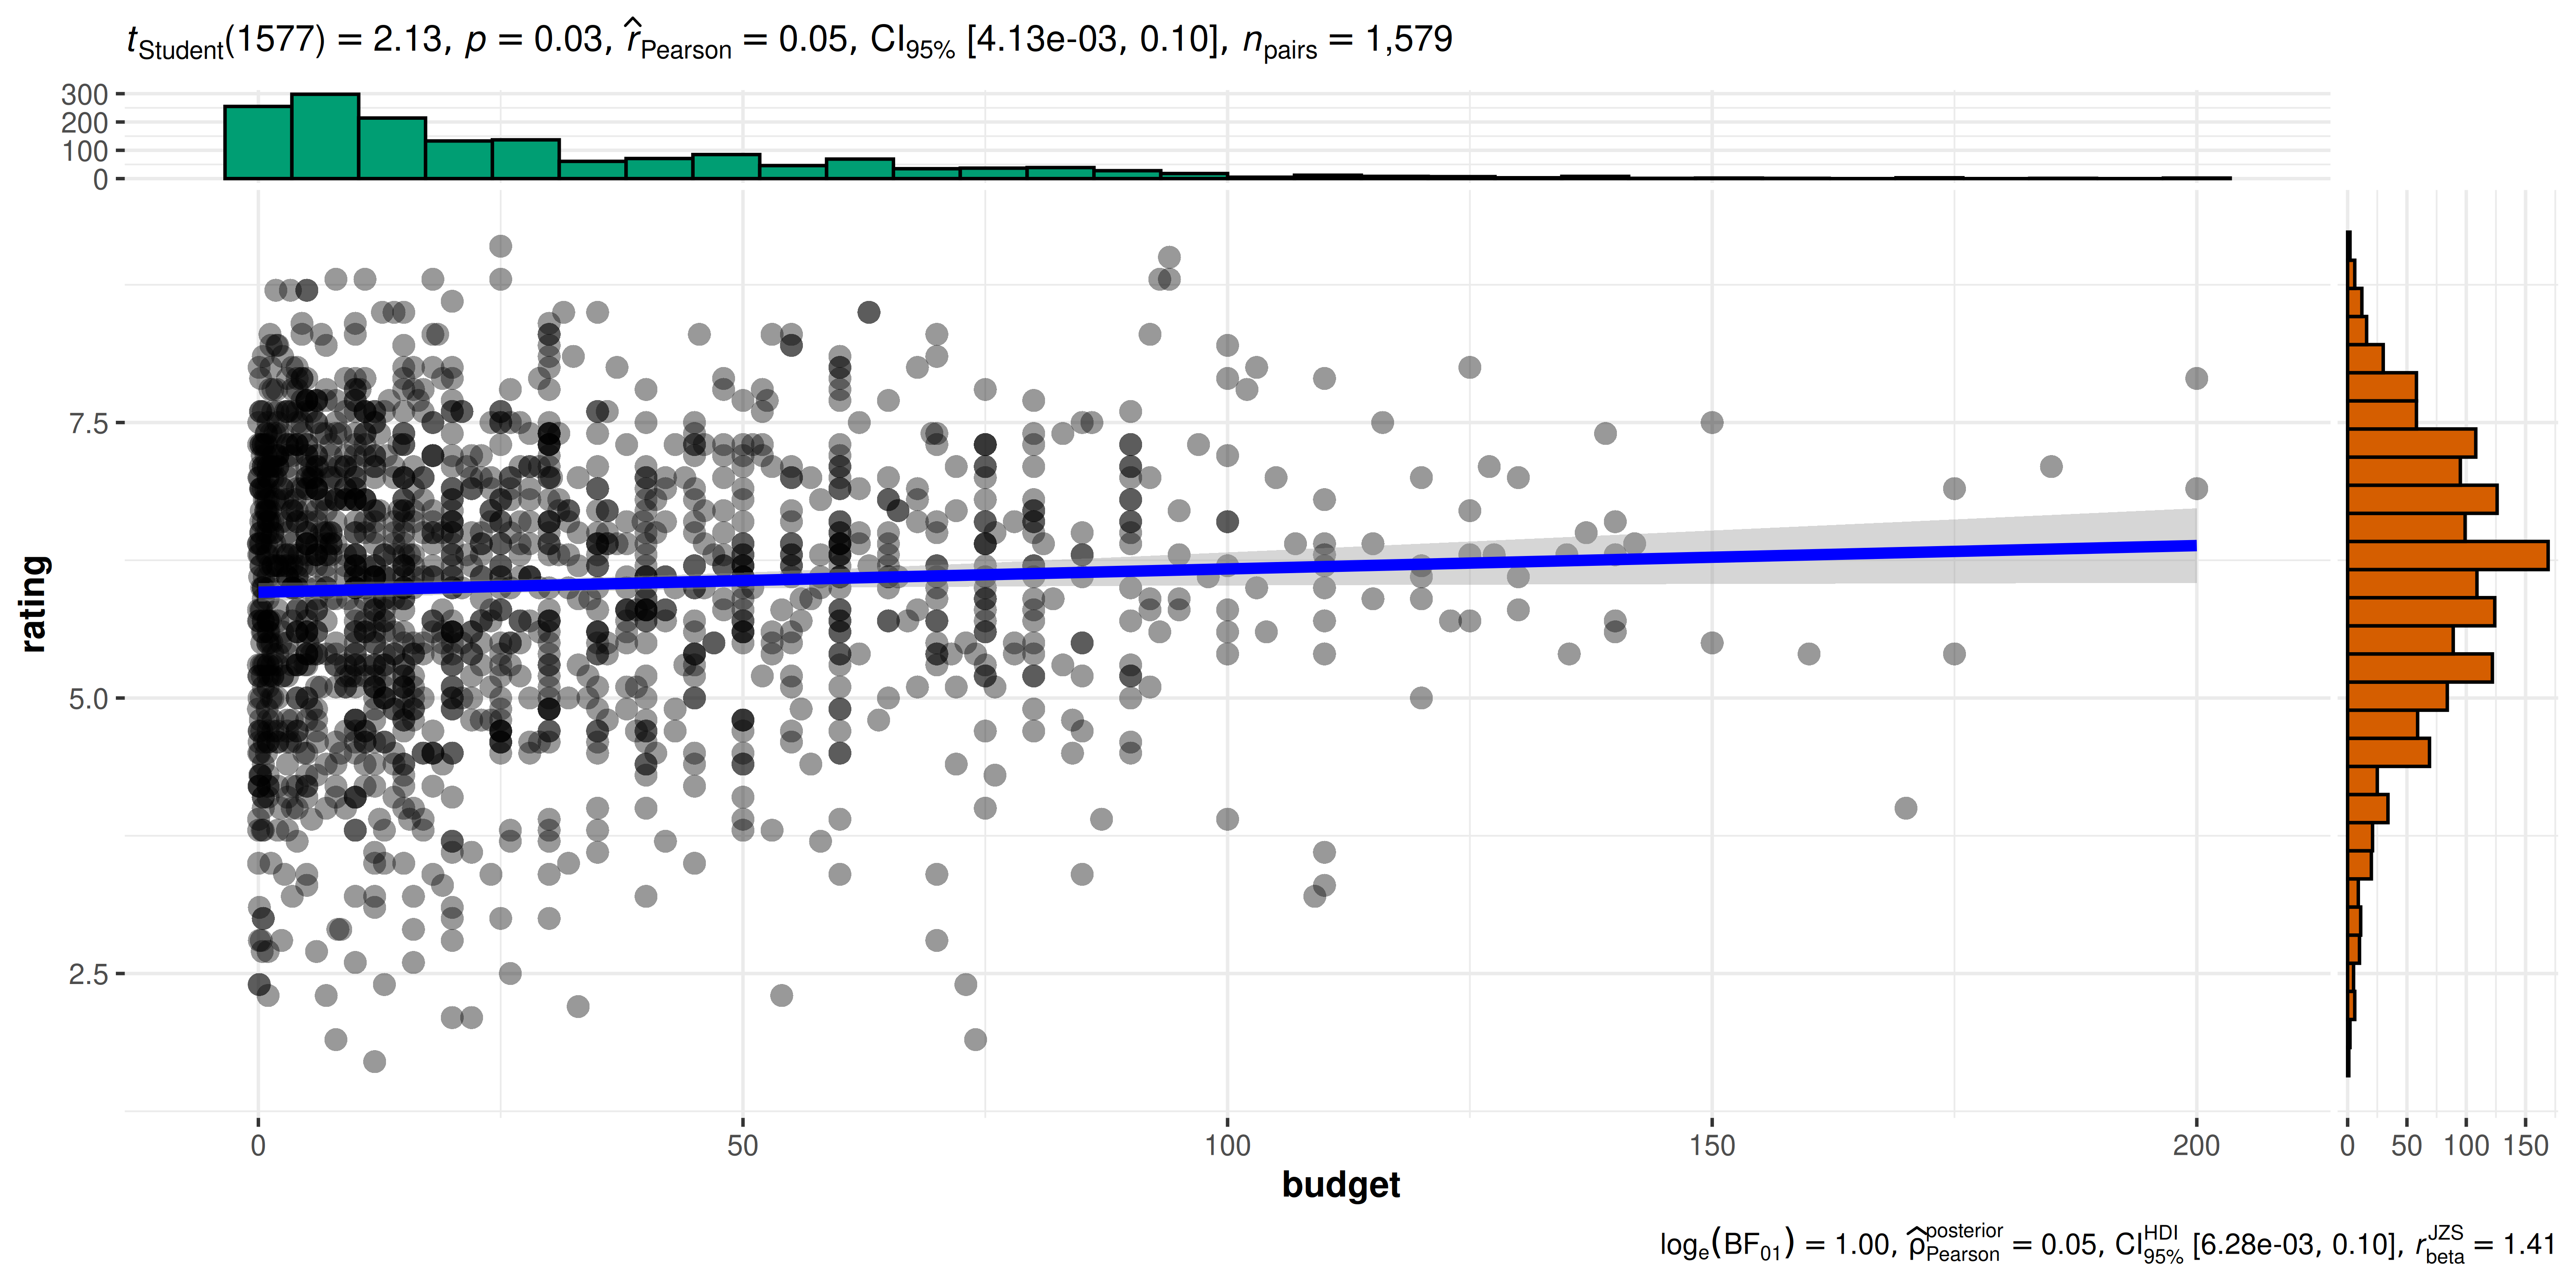
Scatterplot of movie budget against rating, with marginal distributions, a fitted relationship, and correlation statistics.

Important

✏️ Defaults

  • joint distribution
  • marginal distribution
  • effect size + uncertainty
  • pairwise comparisons
  • Bayesian hypothesis-testing
  • Bayesian estimation

Statistical approaches available

  • parametric
  • parametric
  • robust
  • Bayesian

ggcorrmat()

Hypothesis about correlation: Multiple numeric variables

ggcorrmat(dplyr::starwars)
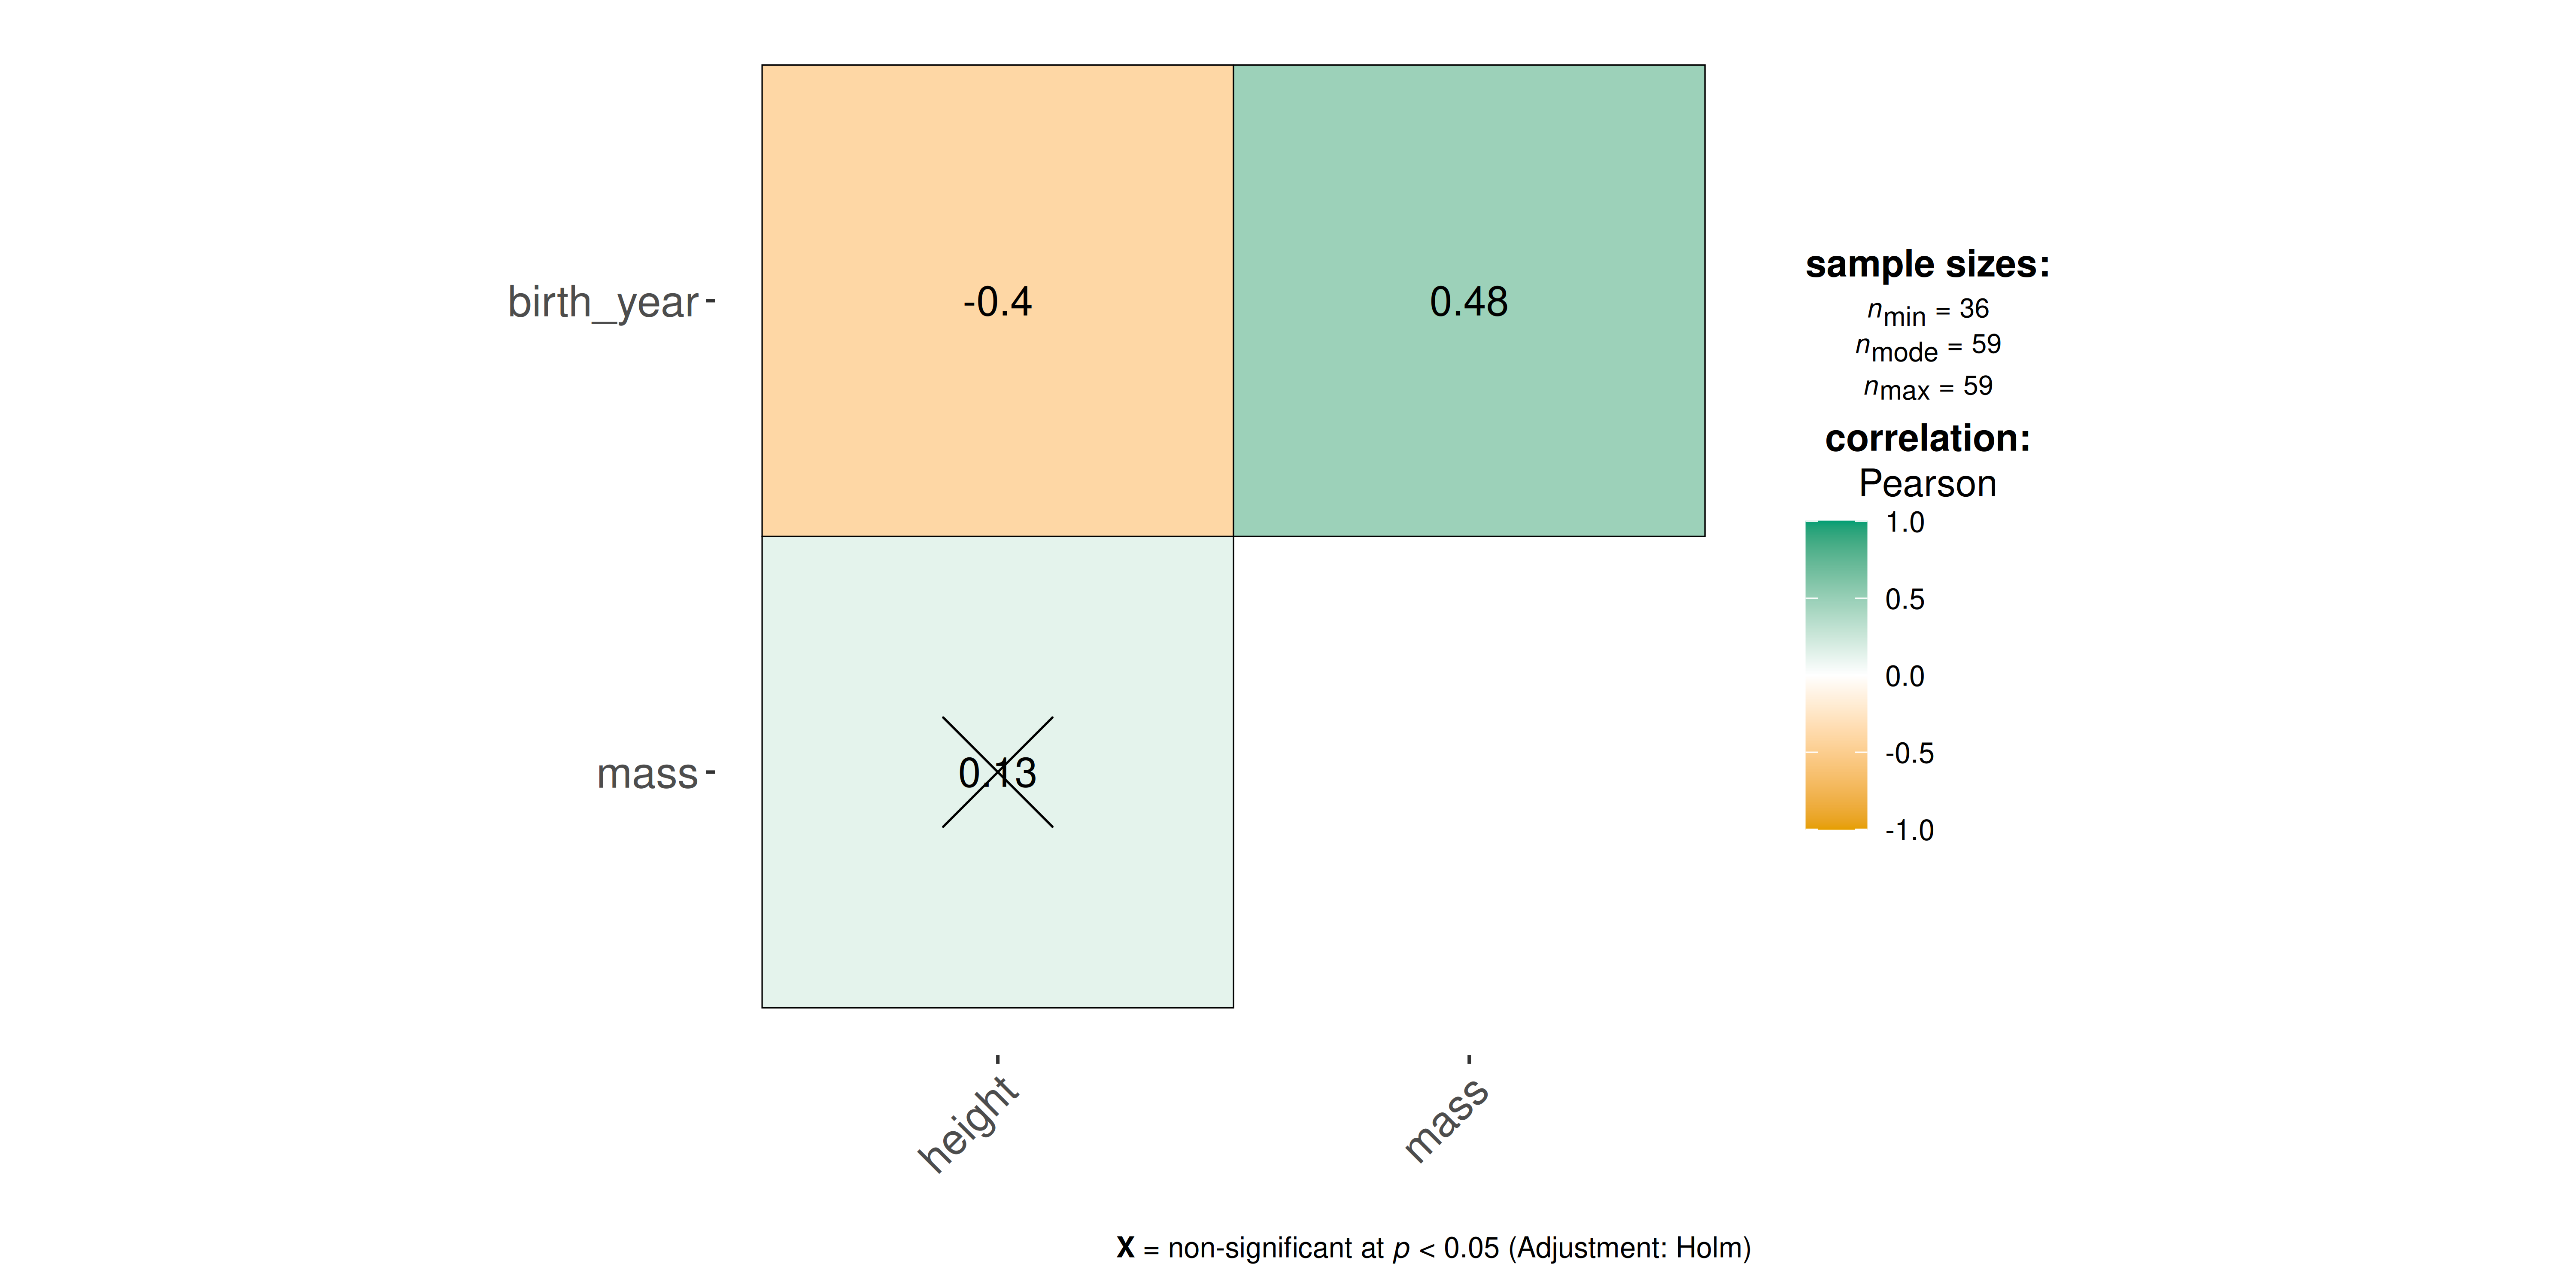
Correlation matrix for numeric variables in the Star Wars dataset, using color and labels to show the direction and strength of relationships.

Important

✏️ Defaults

  • inferential statistics
  • effect size + uncertainty
  • careful handling of NAs
  • partial correlations

Statistical approaches available

  • parametric
  • parametric
  • robust
  • Bayesian

ggpiestats()

Hypothesis about composition of categorical variables

ggpiestats(
  data = mtcars,
  x = am,
  y = cyl
)
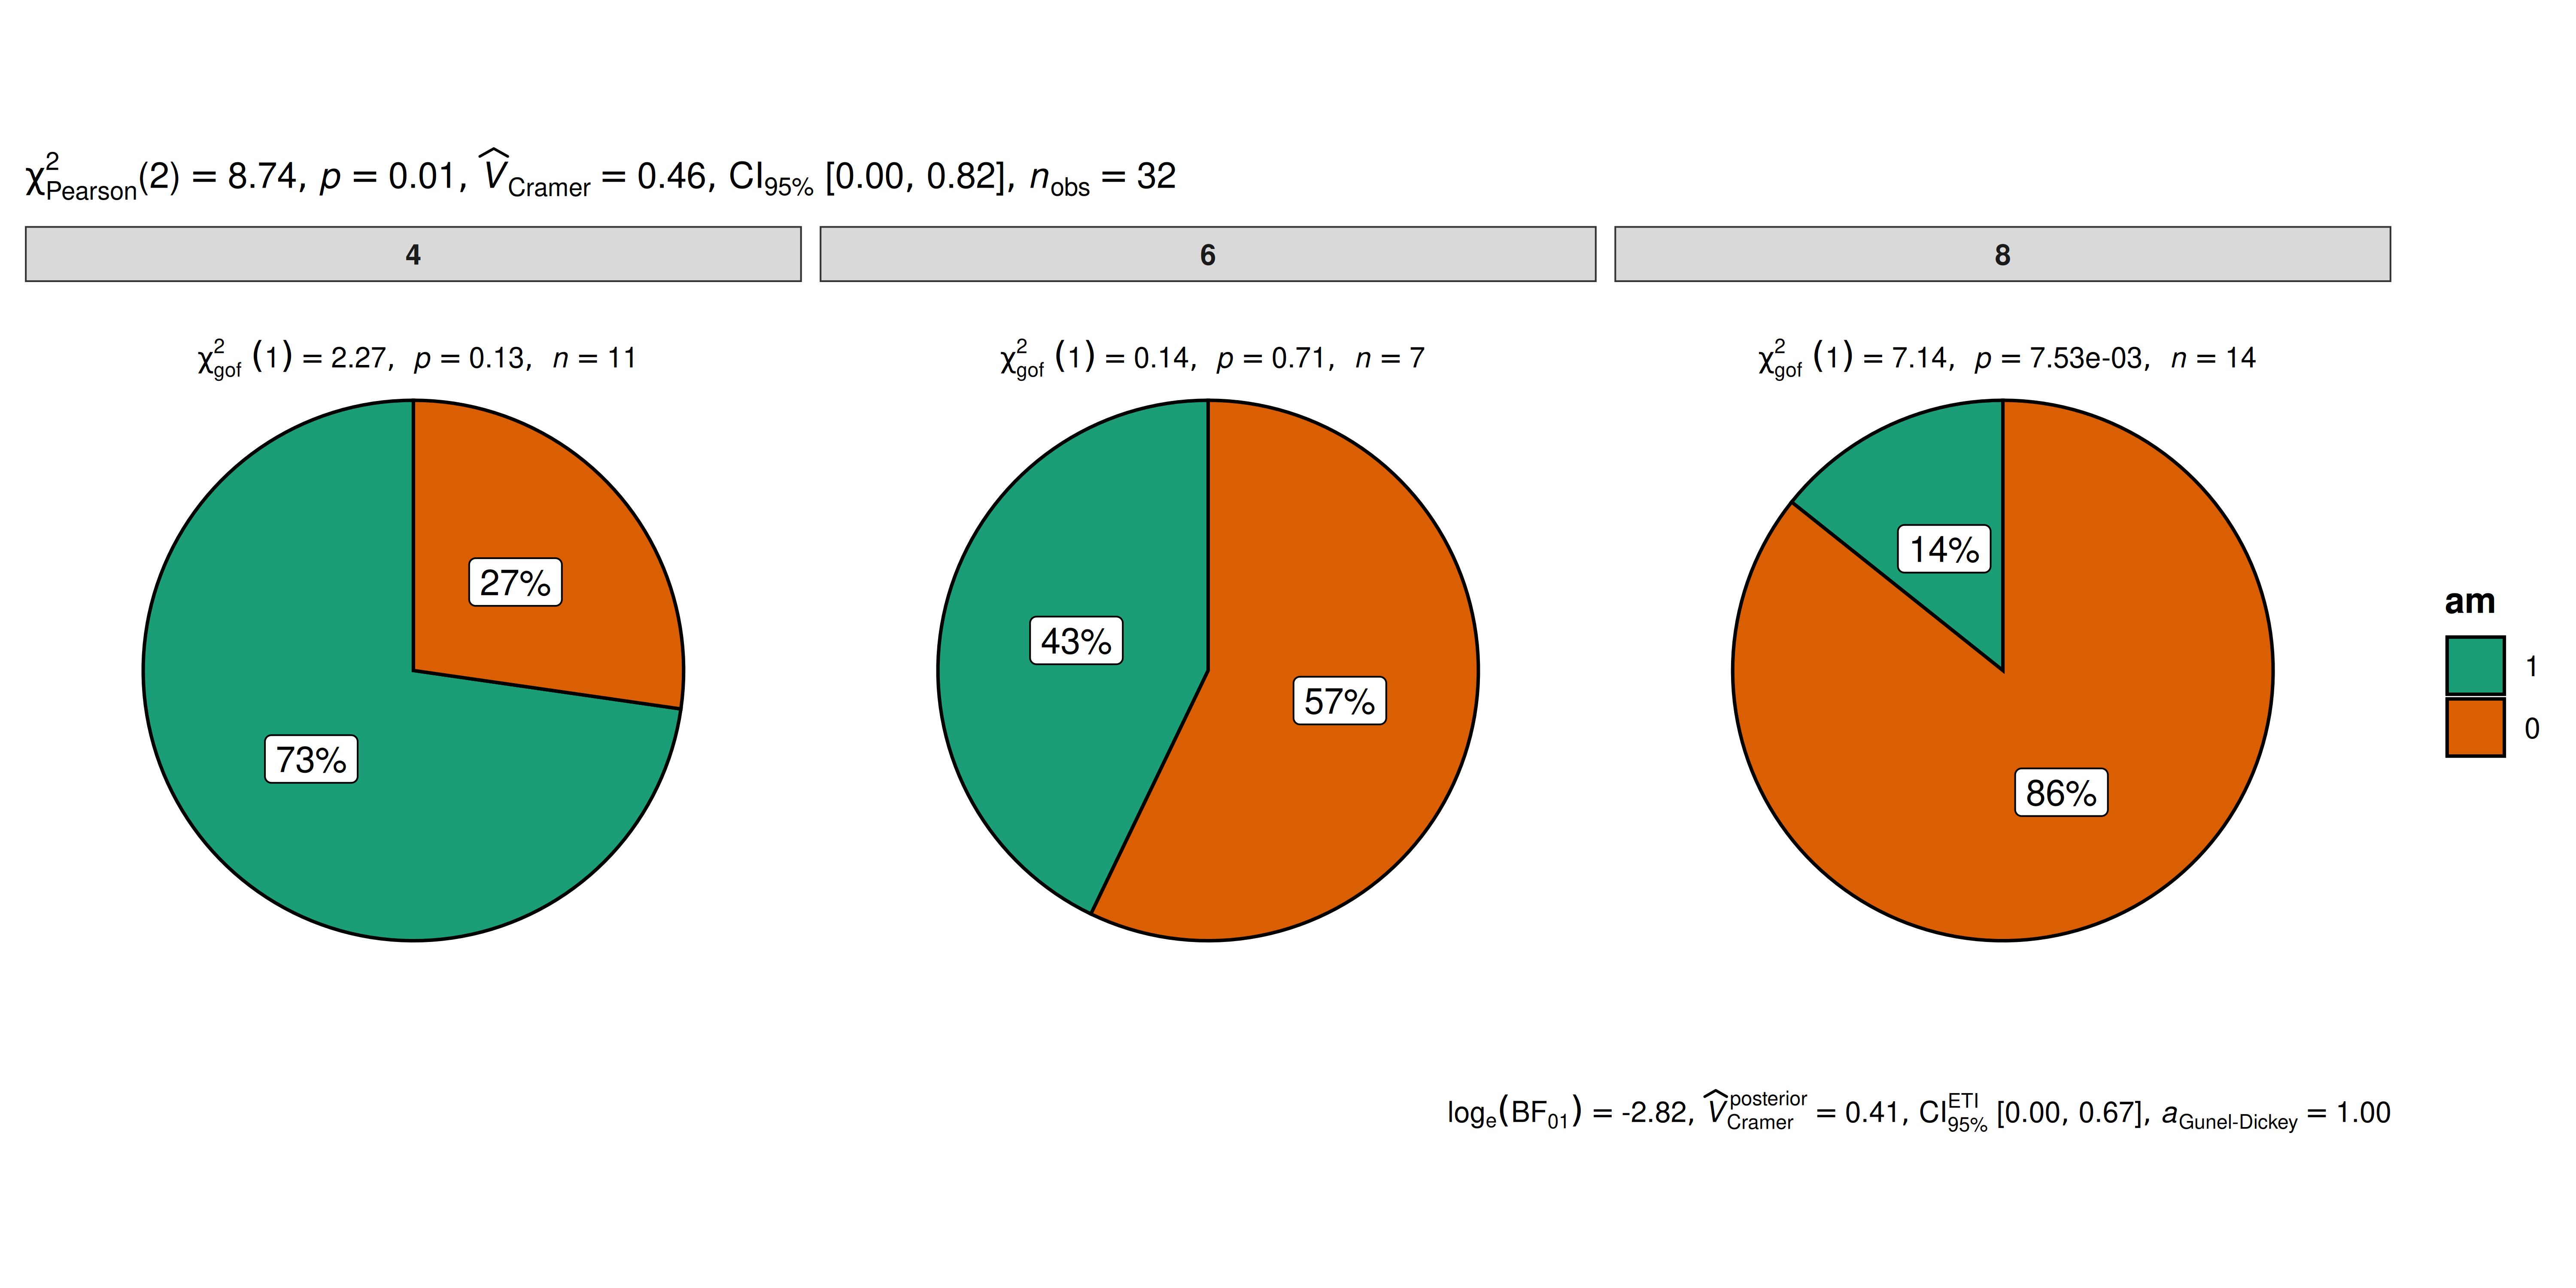
Pie charts comparing transmission categories across cylinder groups in the mtcars dataset, with proportions and association statistics.

Important

✏️ Defaults

  • descriptive statistics
  • inferential statistics
  • effect size + uncertainty
  • goodness-of-fit tests
  • Bayesian hypothesis-testing
  • Bayesian estimation

ggbarstats()

Hypothesis about composition of categorical variables

ggbarstats(
  data = mtcars,
  x = am,
  y = cyl
)
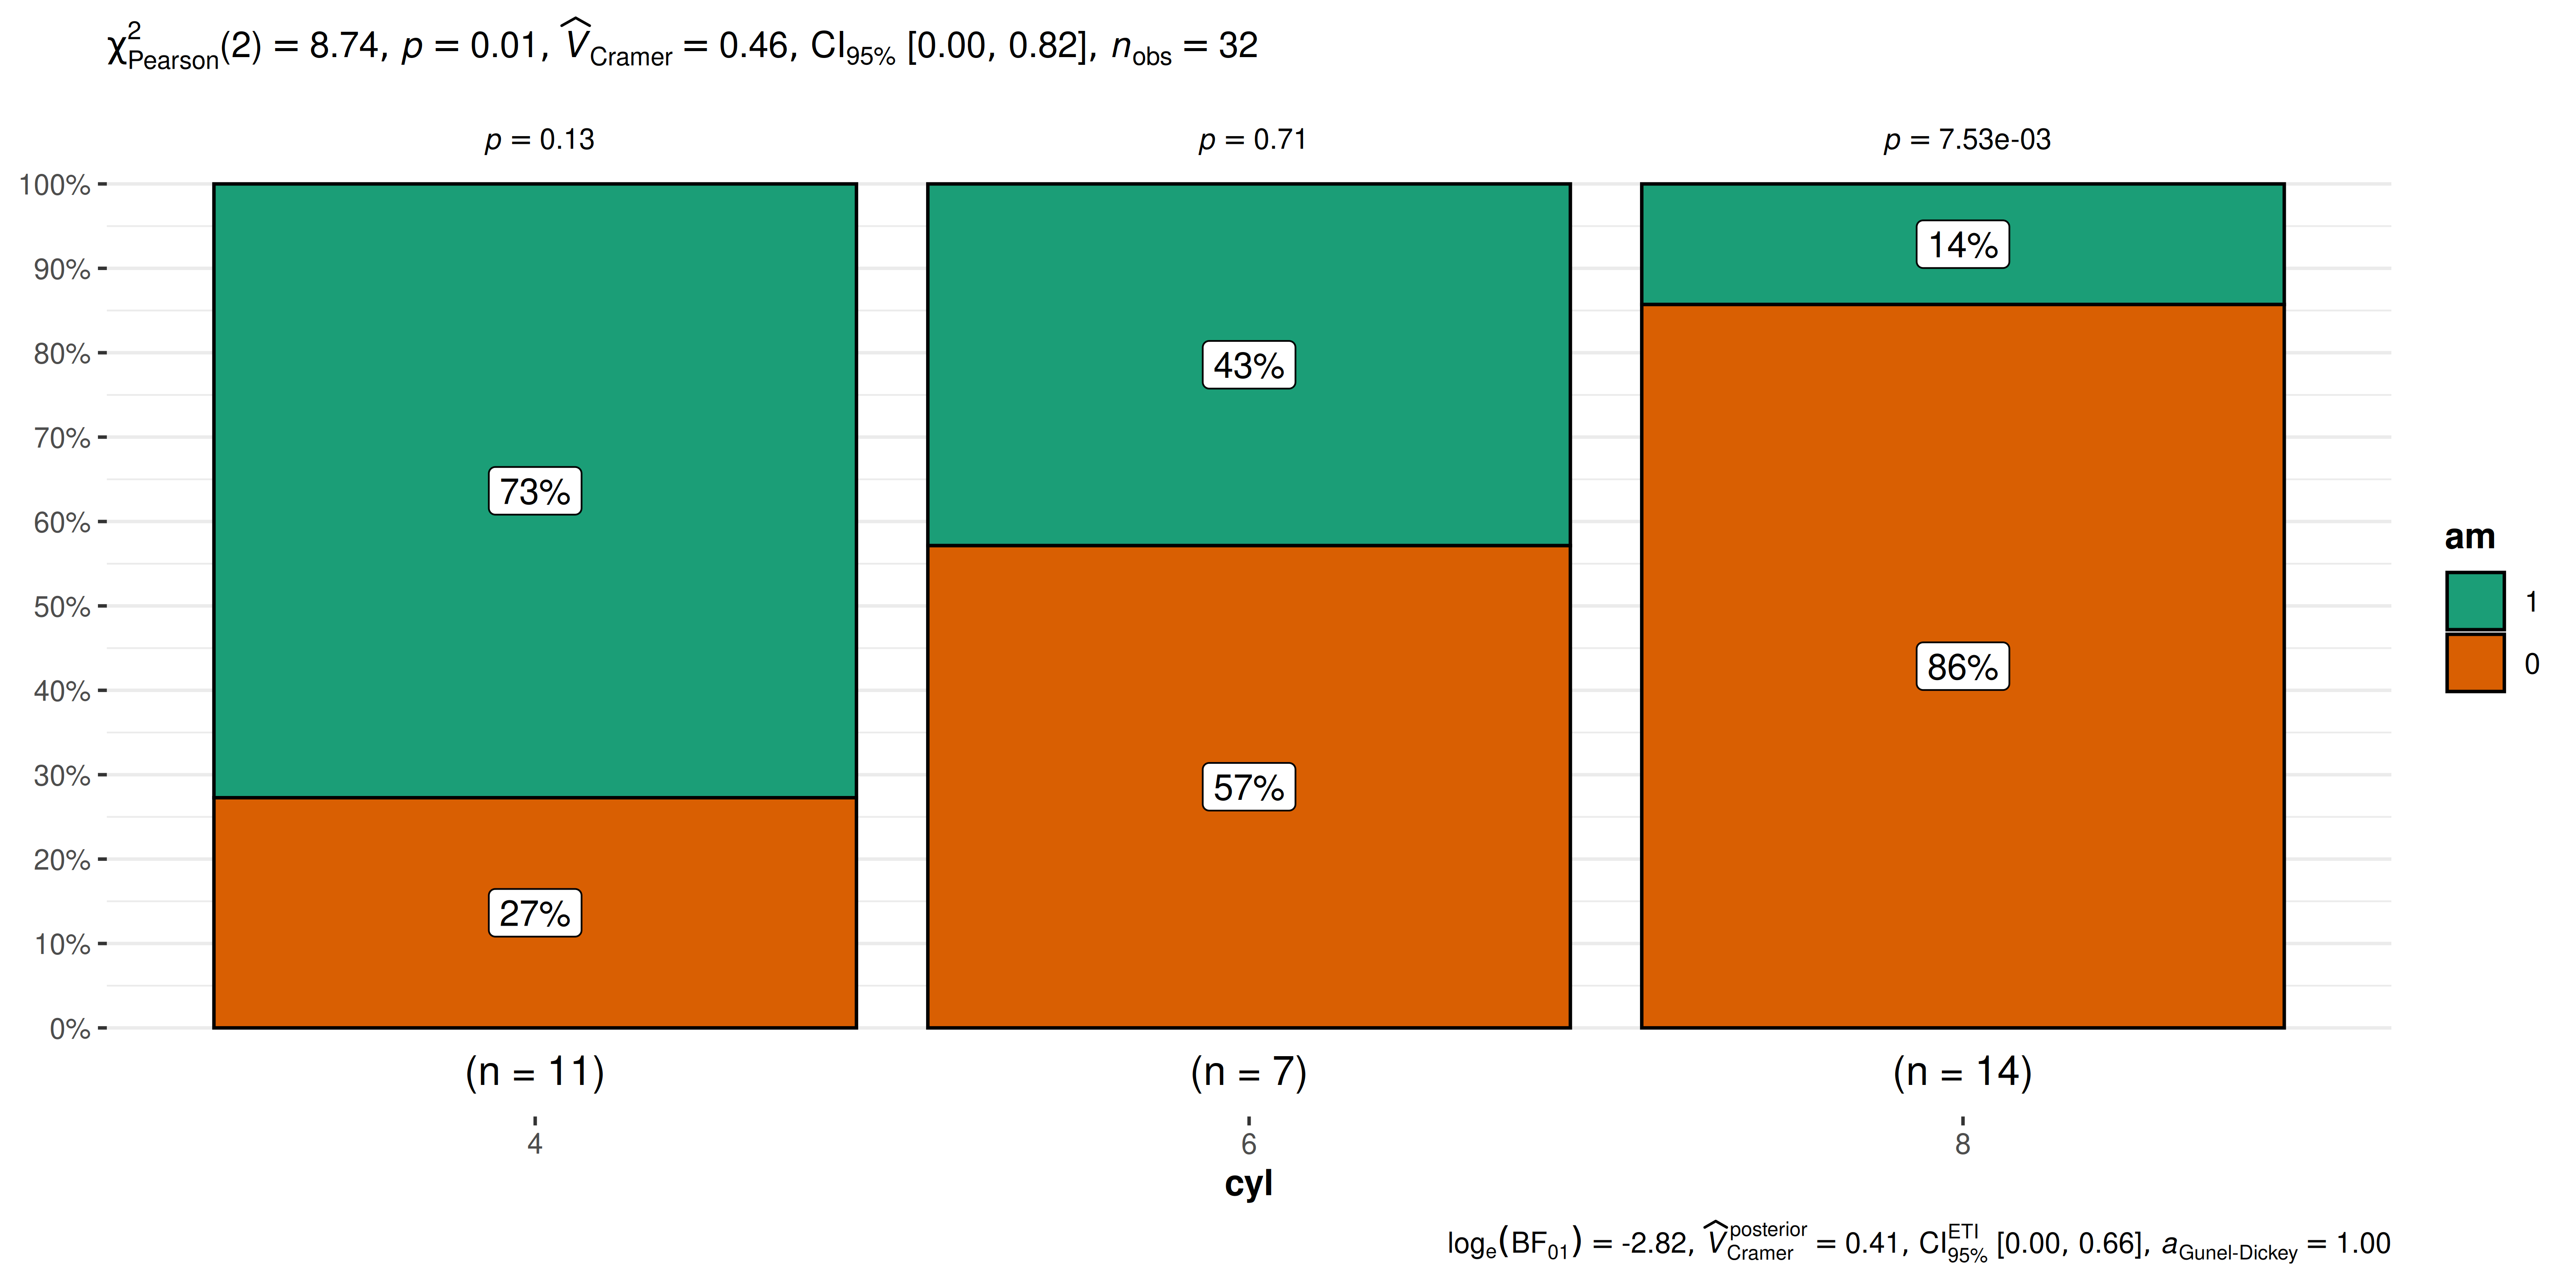
Stacked bar chart comparing transmission categories across cylinder groups in mtcars, with counts, proportions, and association statistics.

Important

✏️ Defaults

  • descriptive statistics
  • inferential statistics
  • effect size + uncertainty
  • goodness-of-fit tests
  • Bayesian hypothesis-testing
  • Bayesian estimation

ggcoefstats()

Hypothesis about regression coefficients

mod <- lm(
  formula = rating ~ mpaa,
  data = movies_long
)

ggcoefstats(mod)
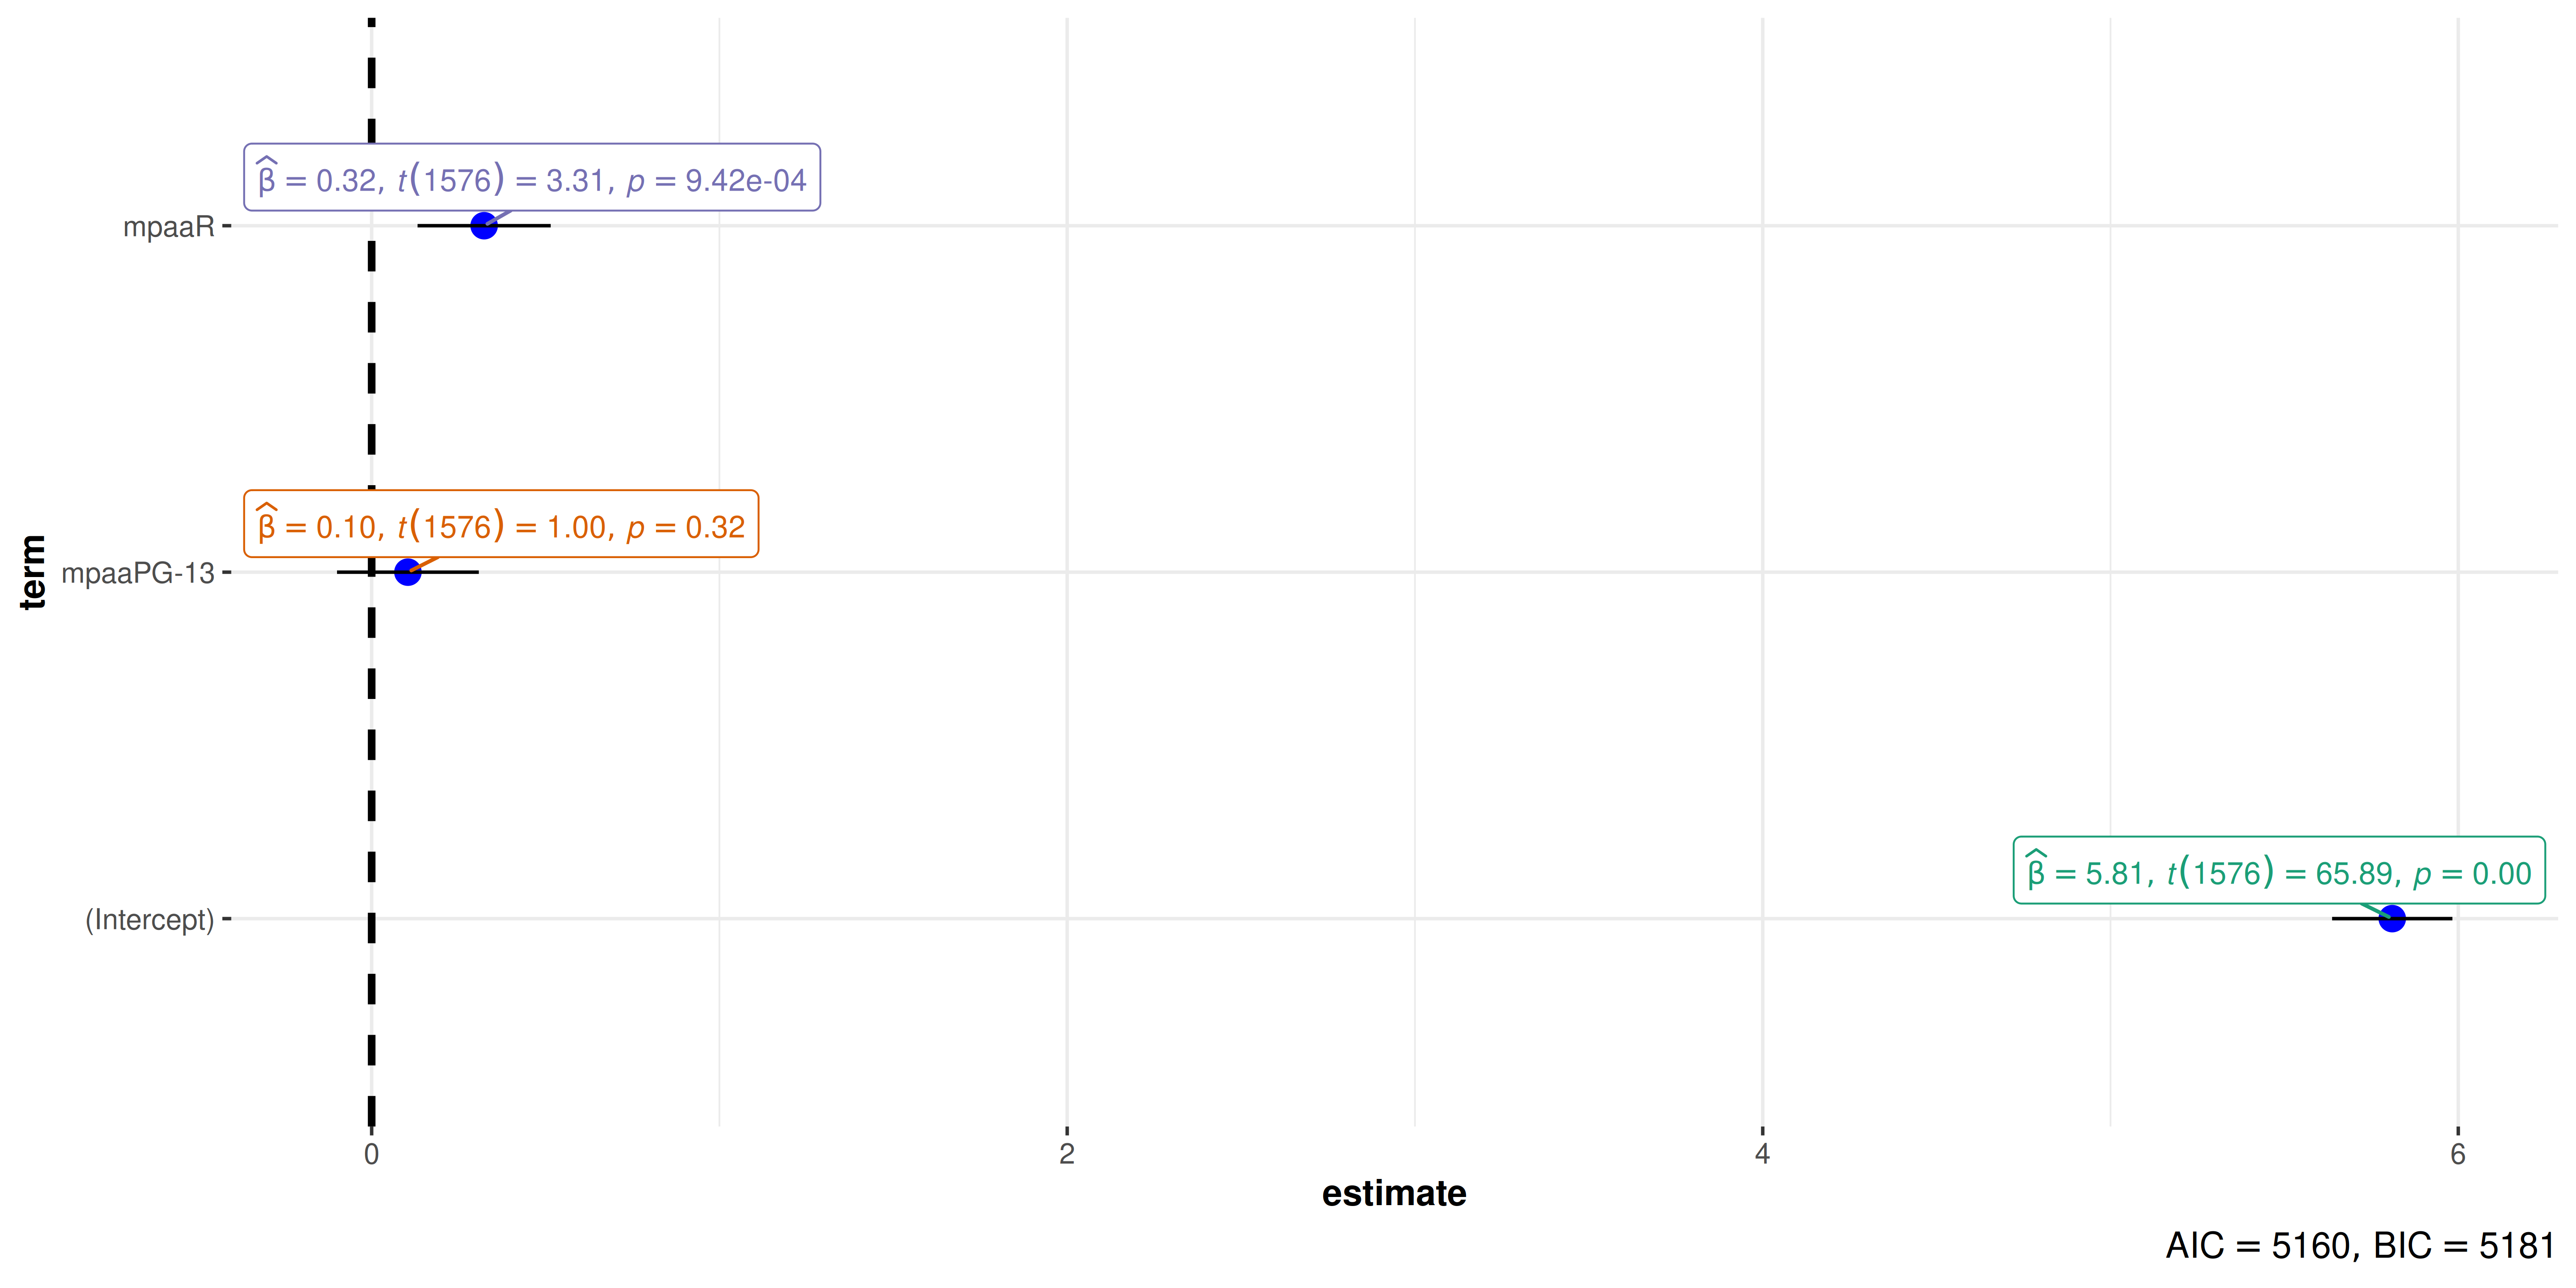
Regression coefficient estimates and uncertainty intervals for a model of movie ratings by MPAA category.

Important

✏️ Defaults

  • estimate + uncertainty
  • inferential statistics (\(t\), \(z\), \(F\), \(\chi^2\))
  • model fit indices (AIC + BIC)

Supports all regression models supported in {easystats} ecosystem.

Meta-analysis is also supported!

grouped_ variants

Iterating over a grouping variable

grouped_ functions

grouped_ggpiestats(
  data = mtcars,
  x = cyl,
  grouping.var = am 
)
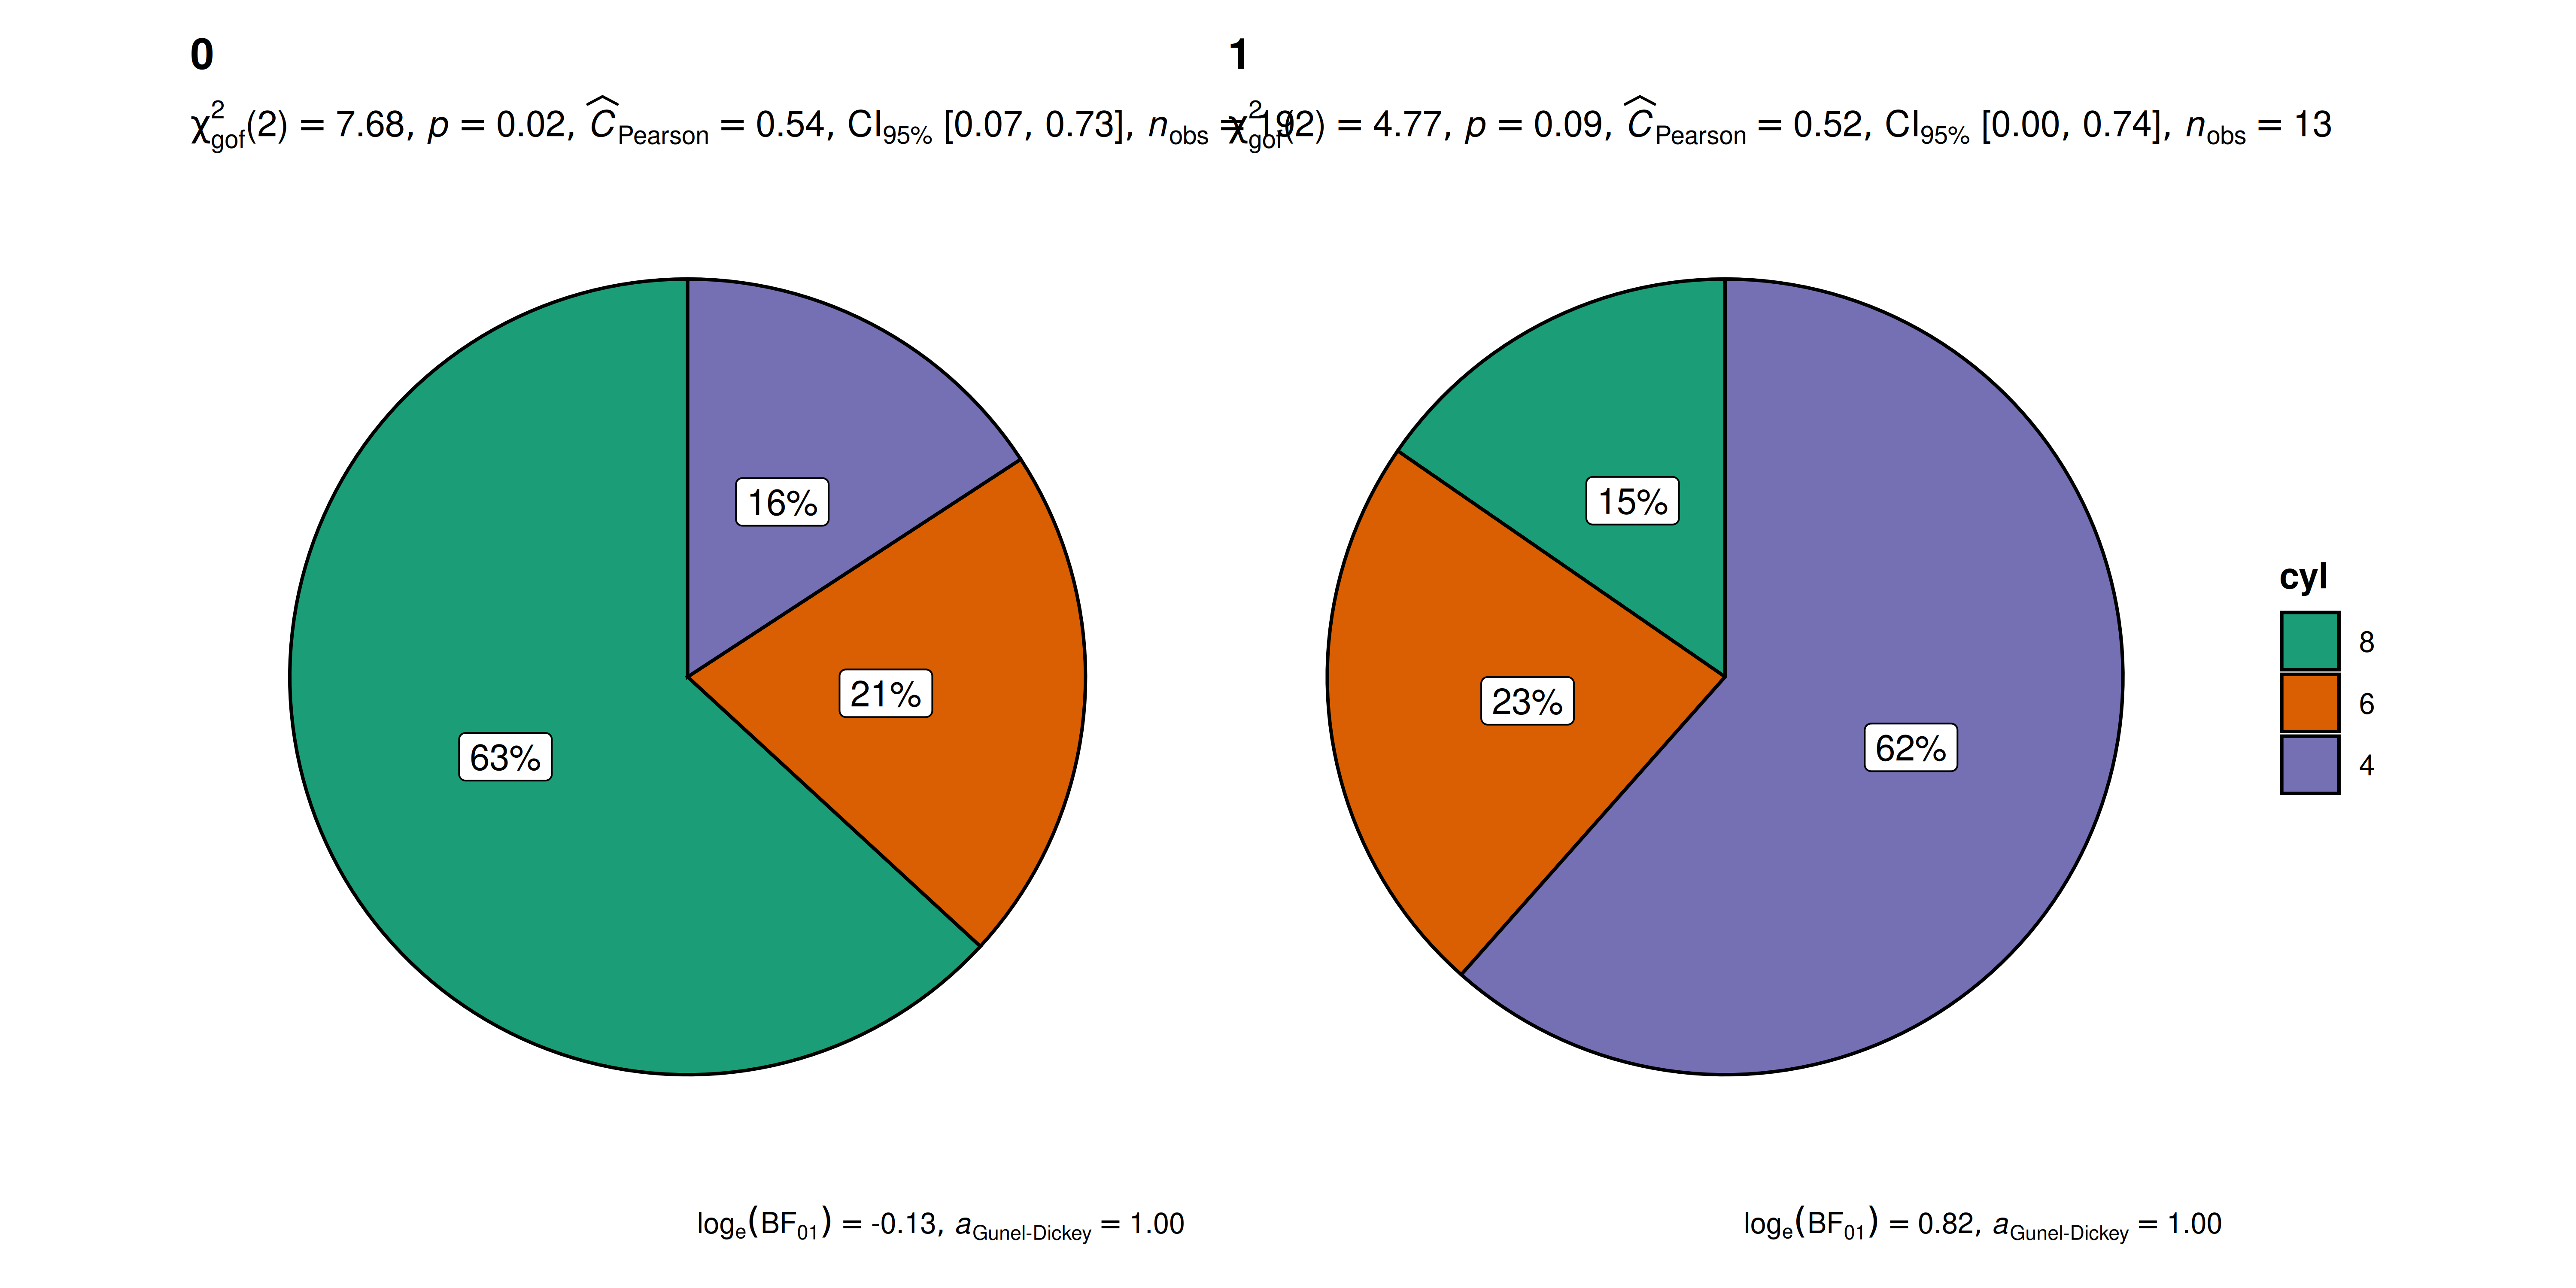
Pie charts of cylinder counts in mtcars, separately for automatic and manual transmission groups, with proportions and statistical summaries.

Available grouped_ variants:

  • grouped_ggbetweenstats()
  • grouped_ggwithinstats()
  • grouped_gghistostats()
  • grouped_ggdotplotstats()
  • grouped_ggscatterstats()
  • grouped_ggcorrmat()
  • grouped_ggpiestats()
  • grouped_ggbarstats()

Customizability

“What if I don’t like the default plots?” 🤔

Modify the look 🎨

By changing theme and palette

ggbetweenstats(
  data = movies_long,
  x = mpaa,
  y = rating,
  ggtheme = ggthemes::theme_economist(),
  palette = "wesanderson::Darjeeling2"
)

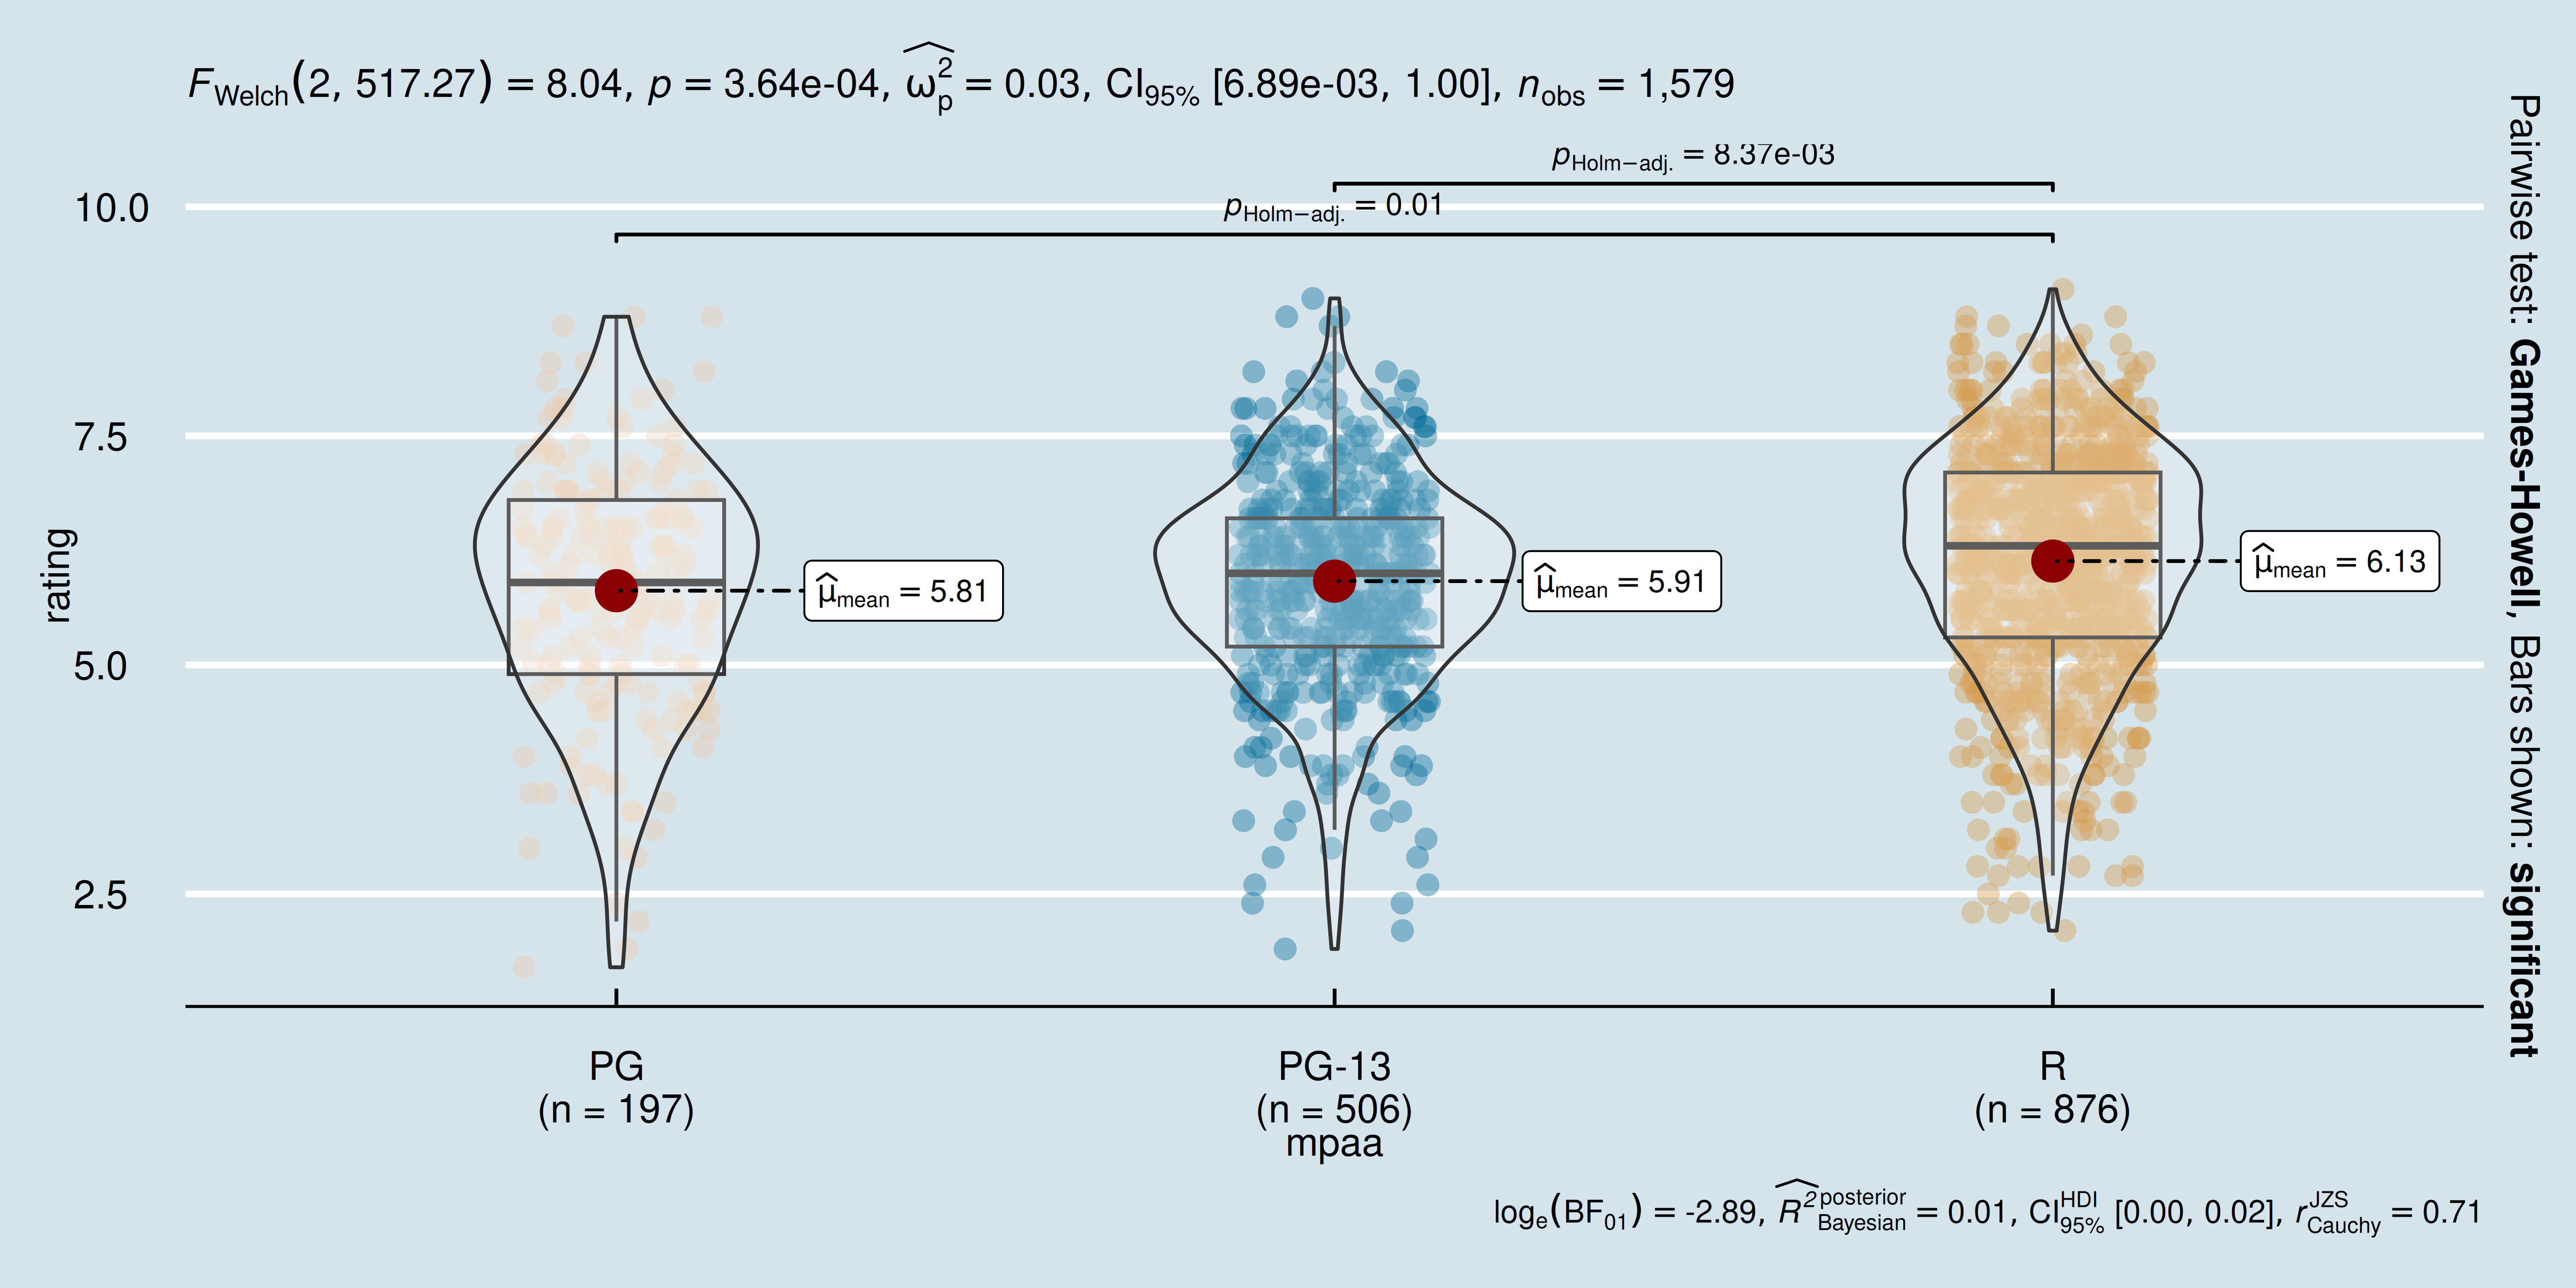
Movie rating distributions by MPAA category, demonstrating a custom Economist theme and Darjeeling color palette.

By using ggplot2 functions

ggbetweenstats(
  data = mtcars,
  x = am,
  y = wt,
  type = "bayes"
) +
  scale_y_continuous(sec.axis = dup_axis()) 

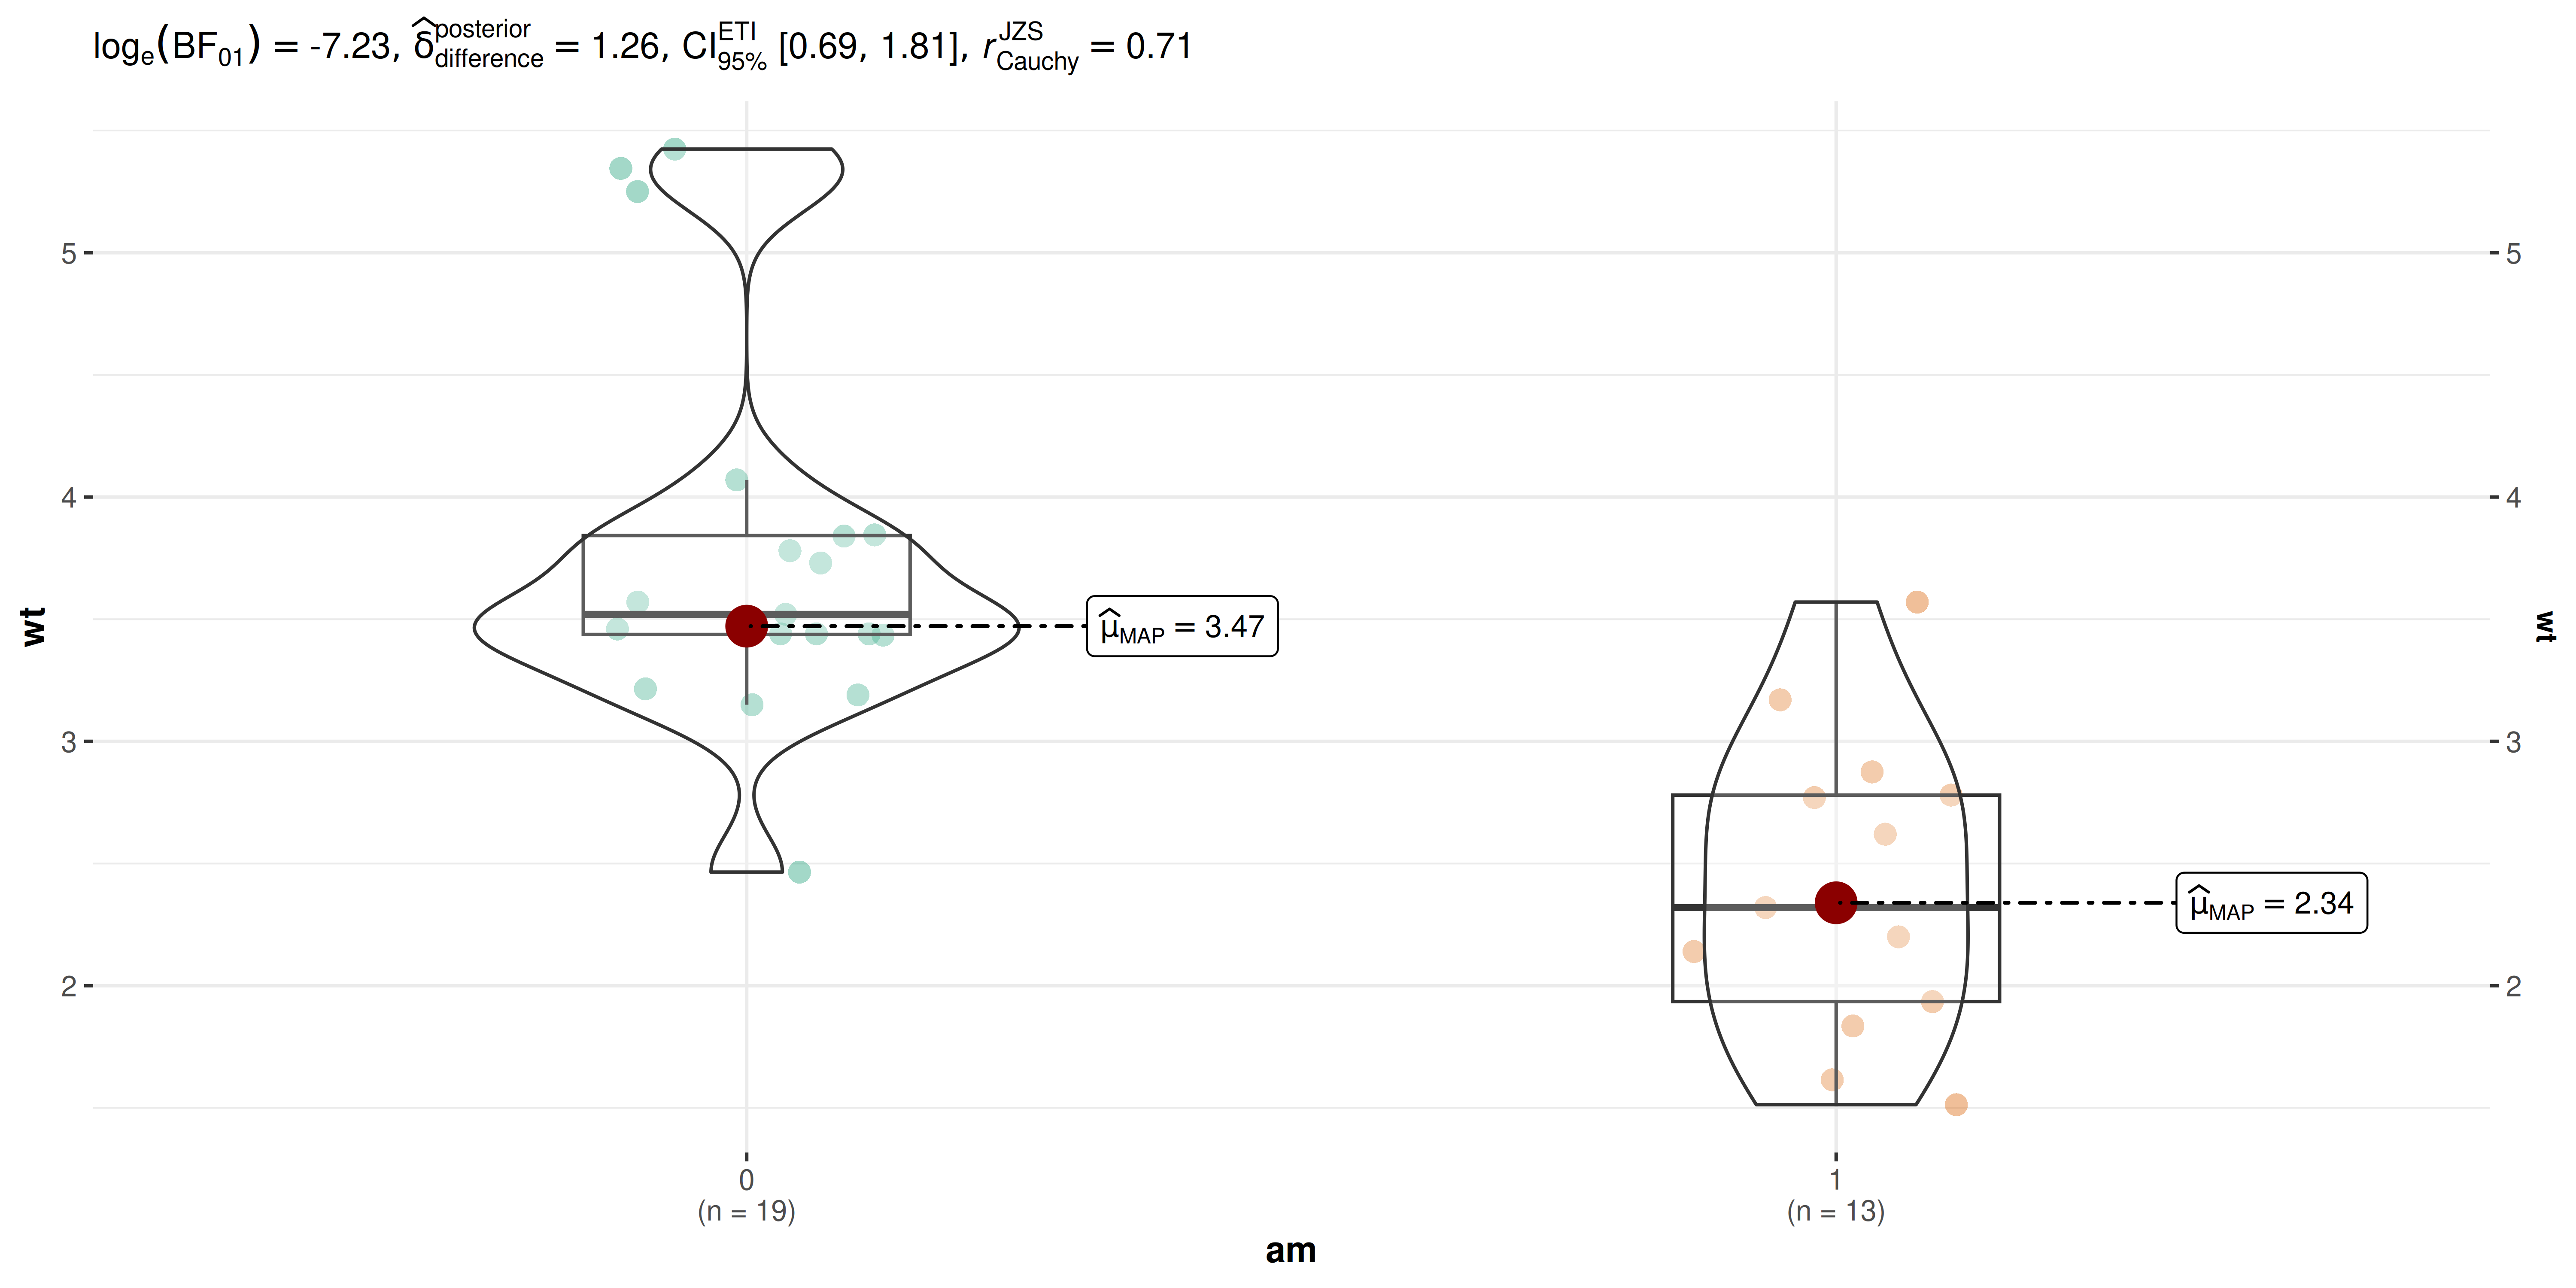
Car weight distributions by transmission type, demonstrating Bayesian statistics and a duplicated vertical axis.

Too much information 🙈

Get only plots:

ggbetweenstats(
  data = iris,
  x = Species,
  y = Sepal.Length,
  # turn off statistical analysis
  centrality.plotting = FALSE, 
  results.subtitle = FALSE, 
  bf.message = FALSE, 
  # turn off pairwise comparisons
  pairwise.display = "none" 
)

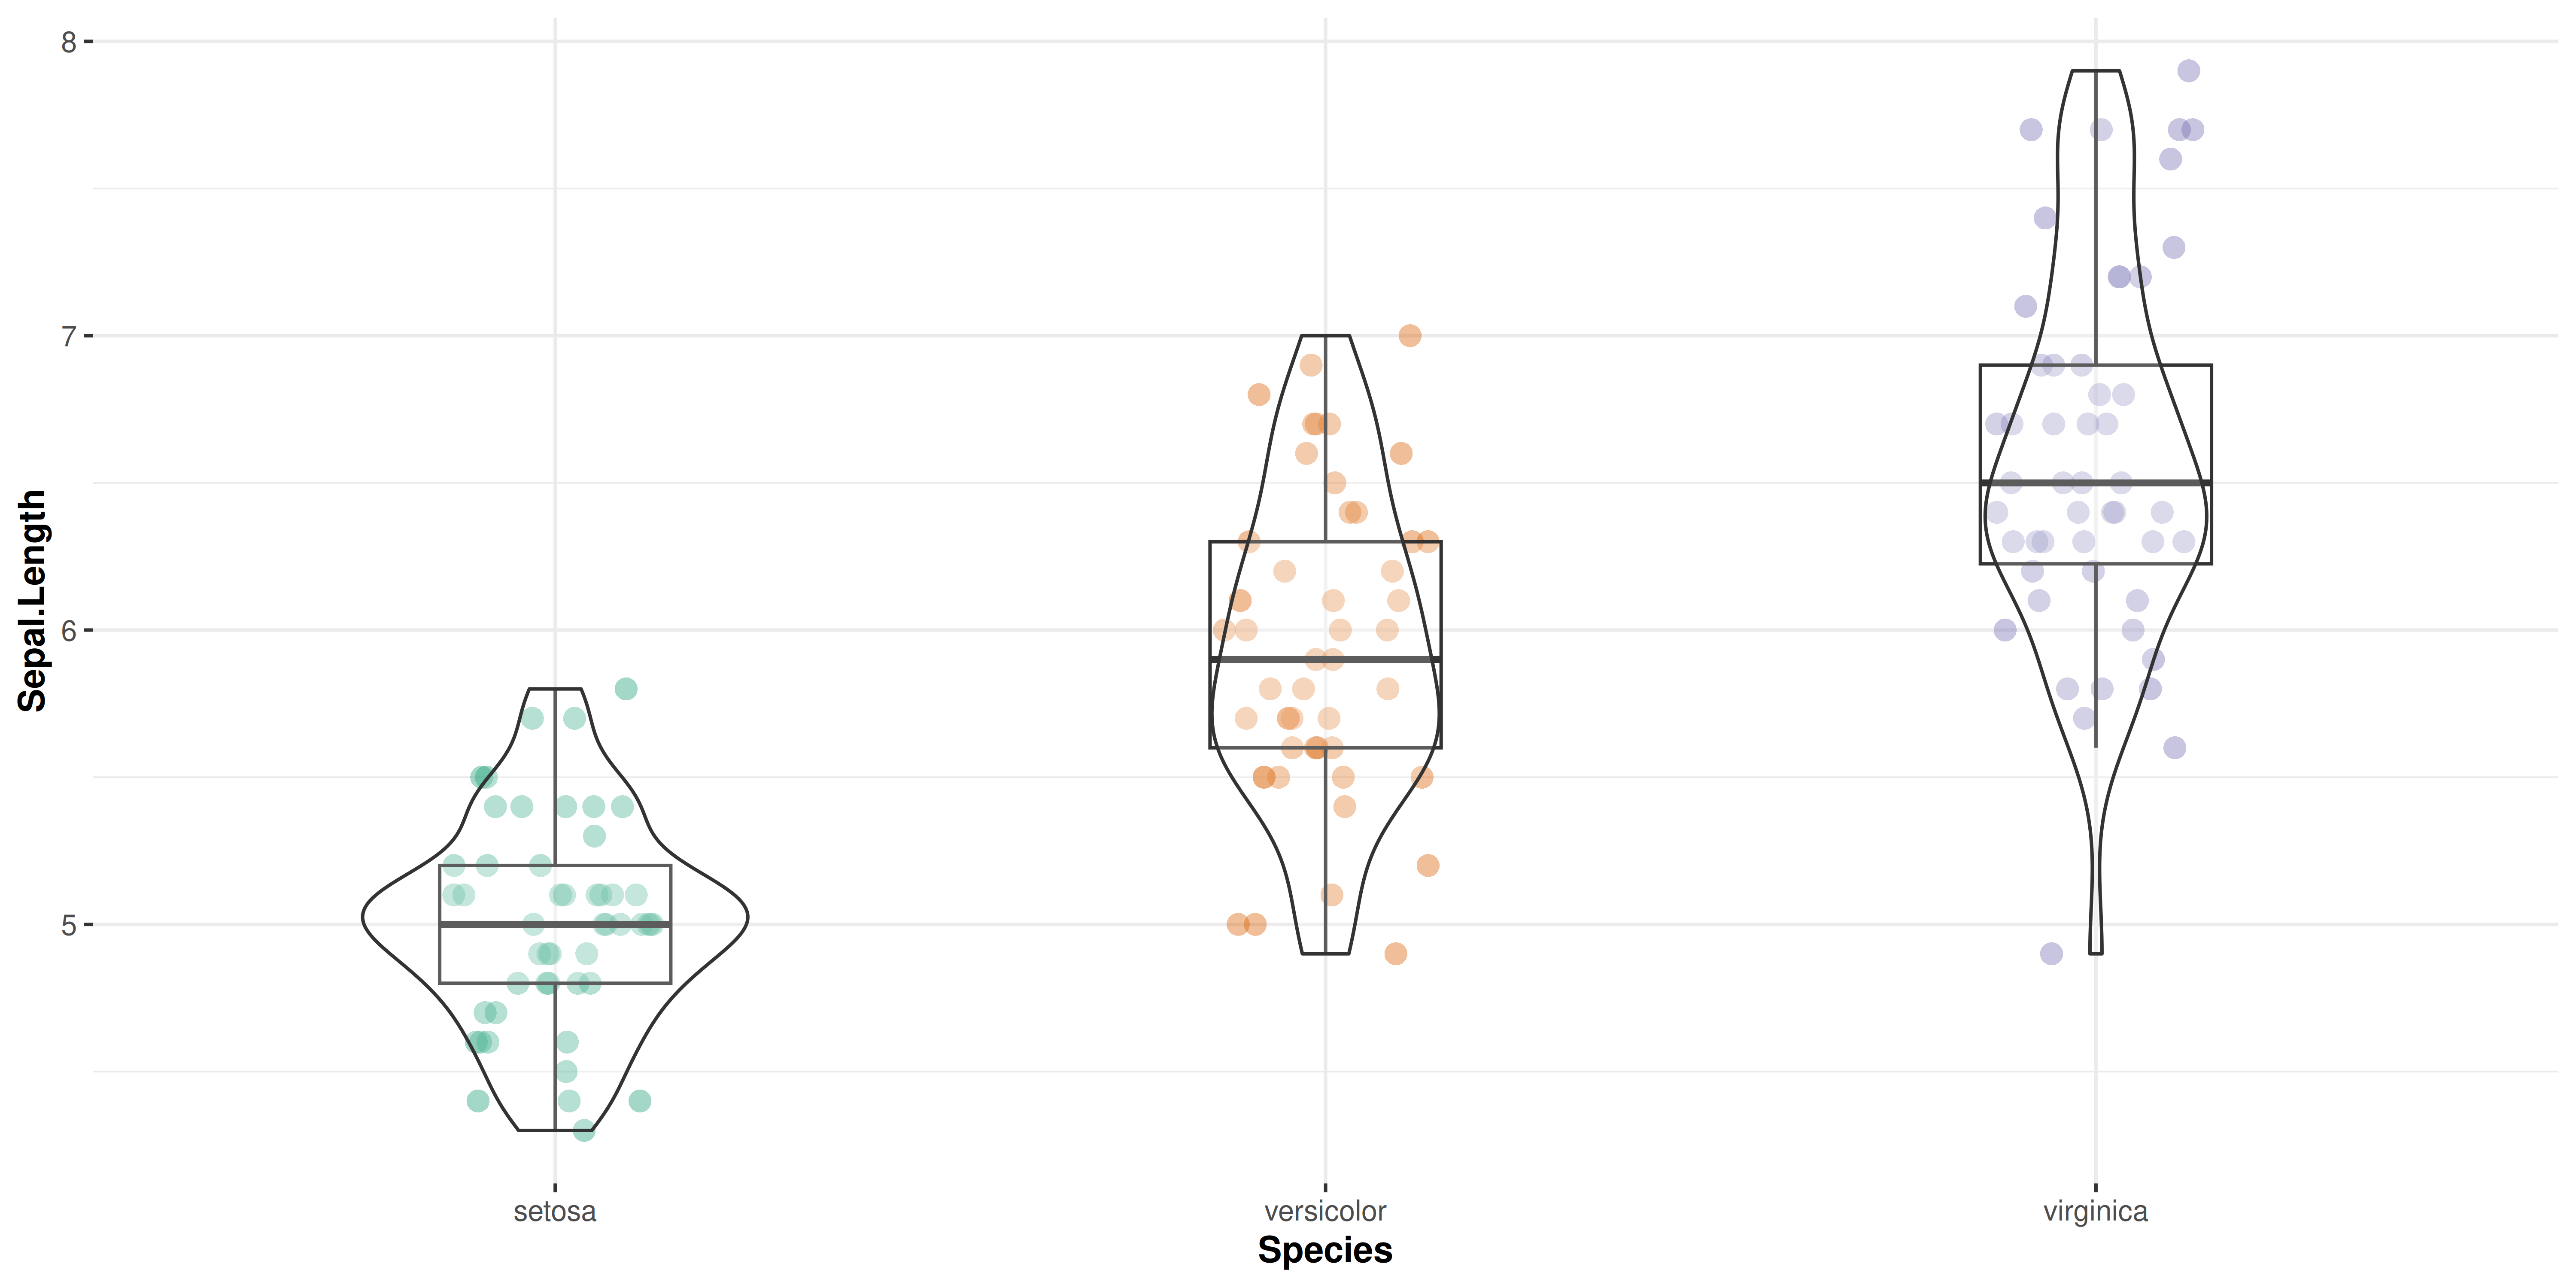
Iris sepal length distributions by species with raw points and violin and box plots; statistical annotations and pairwise comparisons are turned off.

Get only expressions:

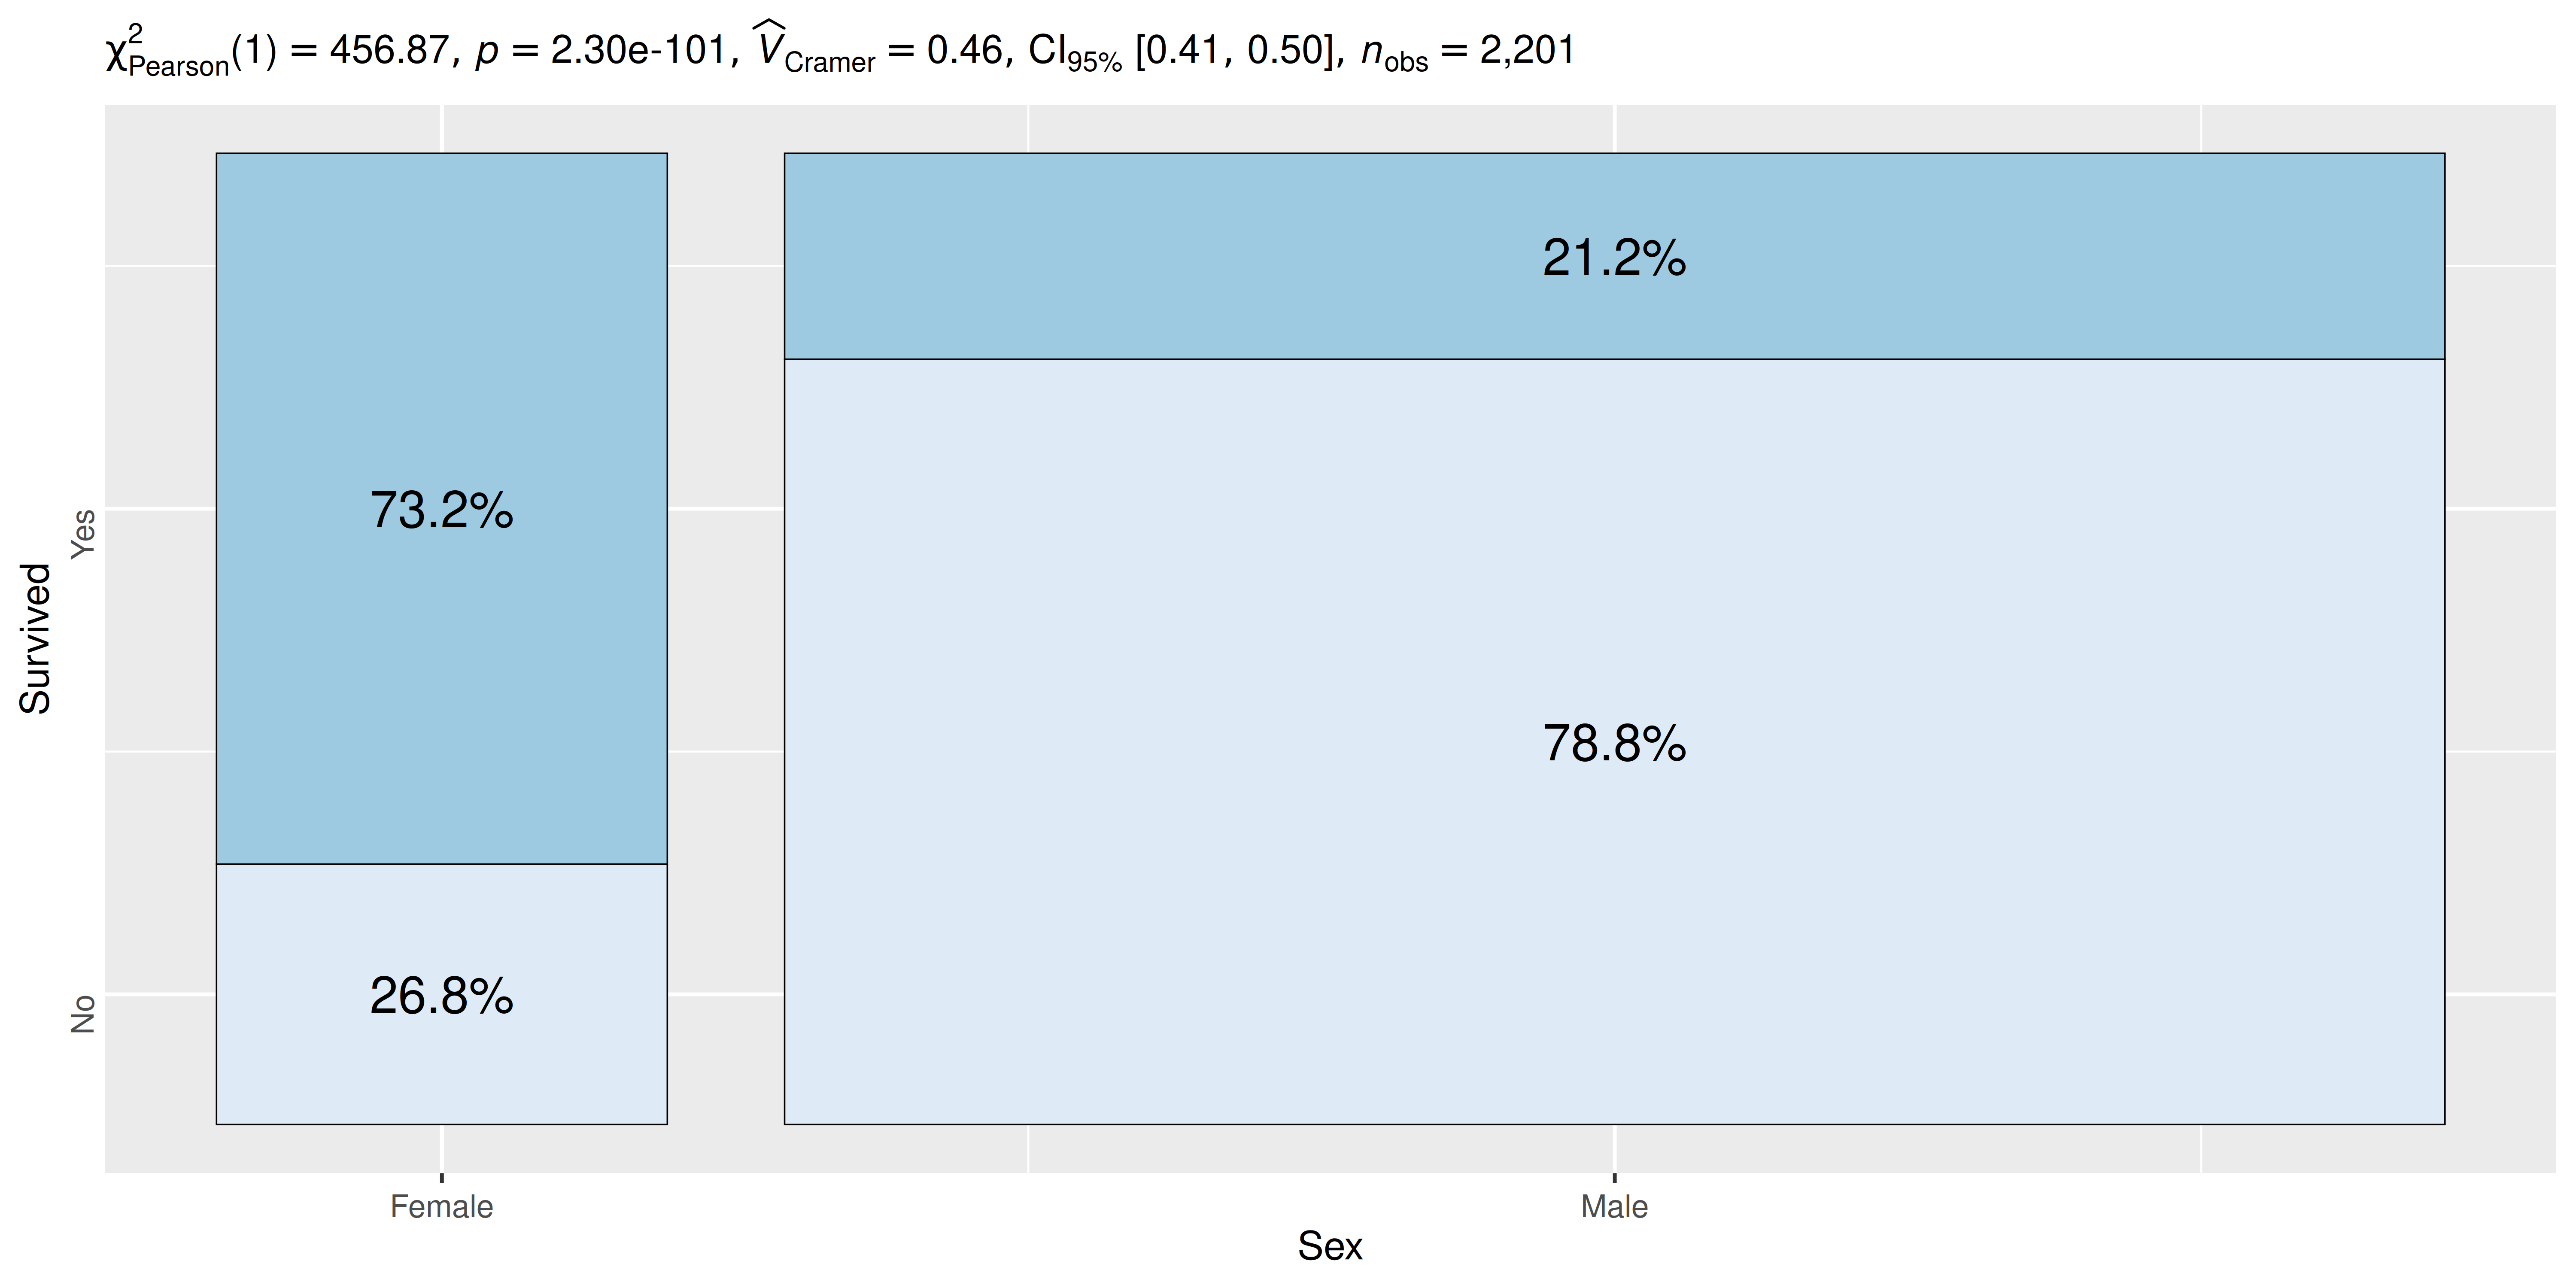
stats_expr <- ggpiestats(
  Titanic_full, Survived, Sex,
) %>% 
  extract_subtitle()

suppressWarnings(print(ggiraphExtra::ggSpine(
  data = Titanic_full,
  aes(x = Sex, fill = Survived)
) +
  labs(subtitle = stats_expr)))

Mosaic-style plot of Titanic survival by sex, with a statistical expression extracted from ggpiestats used as the subtitle.

{ggstatsplot}: Details about statistical reporting

Supports different statistical approaches

Note

Functions Description Parametric Non-parametric Robust Bayesian
ggbetweenstats() Between group comparisons ✅ ✅ ✅ ✅
ggwithinstats() Within group comparisons ✅ ✅ ✅ ✅
gghistostats(), ggdotplotstats() Distribution of a numeric variable ✅ ✅ ✅ ✅
ggcorrmat() Correlation matrix ✅ ✅ ✅ ✅
ggscatterstats() Correlation between two variables ✅ ✅ ✅ ✅
ggpiestats(), ggbarstats() Association between categorical variables ✅ NA NA ✅
ggpiestats(), ggbarstats() Equal proportions for categorical variable levels ✅ NA NA ✅
ggcoefstats() Regression modeling ✅ ✅ ✅ ✅
ggcoefstats() Random-effects meta-analysis ✅ NA ✅ ✅

Toggling statistical approaches 🔀

Parametric

# anova
ggbetweenstats(
  data = mtcars,
  x = cyl,
  y = wt,
  type = "p" 
)

# correlation analysis
ggscatterstats(
  data = mtcars,
  x = wt,
  y = mpg,
  type = "p" 
)

# t-test
gghistostats(
  data = mtcars,
  x = wt,
  test.value = 2,
  type = "p" 
)

Non-parametric

# anova
ggbetweenstats(
  data = mtcars,
  x = cyl,
  y = wt,
  type = "np" 
)

# correlation analysis
ggscatterstats(
  data = mtcars,
  x = wt,
  y = mpg,
  type = "np" 
)

# t-test
gghistostats(
  data = mtcars,
  x = wt,
  test.value = 2,
  type = "np" 
)

Alternative: Pure Pain

Hunting for packages

📦 for inferential statistics ({stats})
📦 computing effect size + CIs (effectsize)
📦 for descriptive statistics (skimr)
📦 pairwise comparisons (multcomp)
📦 Bayesian hypothesis testing (BayesFactor)
📦 Bayesian estimation (bayestestR)
📦 …

A worker struggles with many packages on a loading platform, illustrating the burden of coordinating many statistical packages.

Inconsistent APIs

🤔 accepts data frame, vector, matrix?
🤔 long/wide format data?
🤔 works with NAs?
🤔 returns data frame, vector, matrix?
🤔 works with tibbles?
🤔 has all necessary details?
🤔 …

A monkey uses a laptop, humorously illustrating the frustration of doing repetitive analysis manually.

Benefits in details

ggstatsplot combines data visualization and statistical analysis in a single step.

It…

  • provides ready-made plots with information-rich defaults
  • minimizes the chances of making errors in statistical reporting
  • follows best practices in data visualization and statistical reporting
  • helps evaluate statistical analysis in the context of the underlying data
  • highlights the importance of the effect by providing effect size measures
  • provides an easy way to evaluate absence of an effect using Bayesian framework
  • extremely beginner-friendly

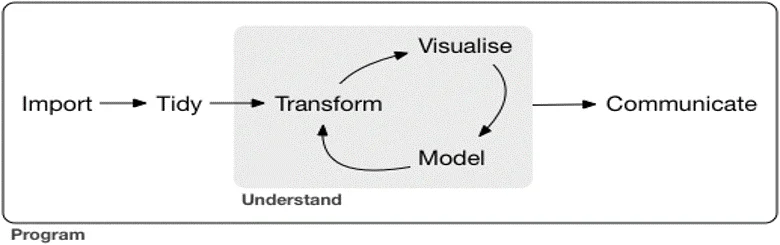
Simplified data analysis workflow

Data analysis proceeds from import and tidying into an iterative cycle of transformation, visualization, and modeling, followed by communication.


✅ Quick insight into data by combining visualization and modeling!

Community Involvement

A grain of salt

The “Golem of Prague” problem


❌ Promotes mindless application of statistical tests.
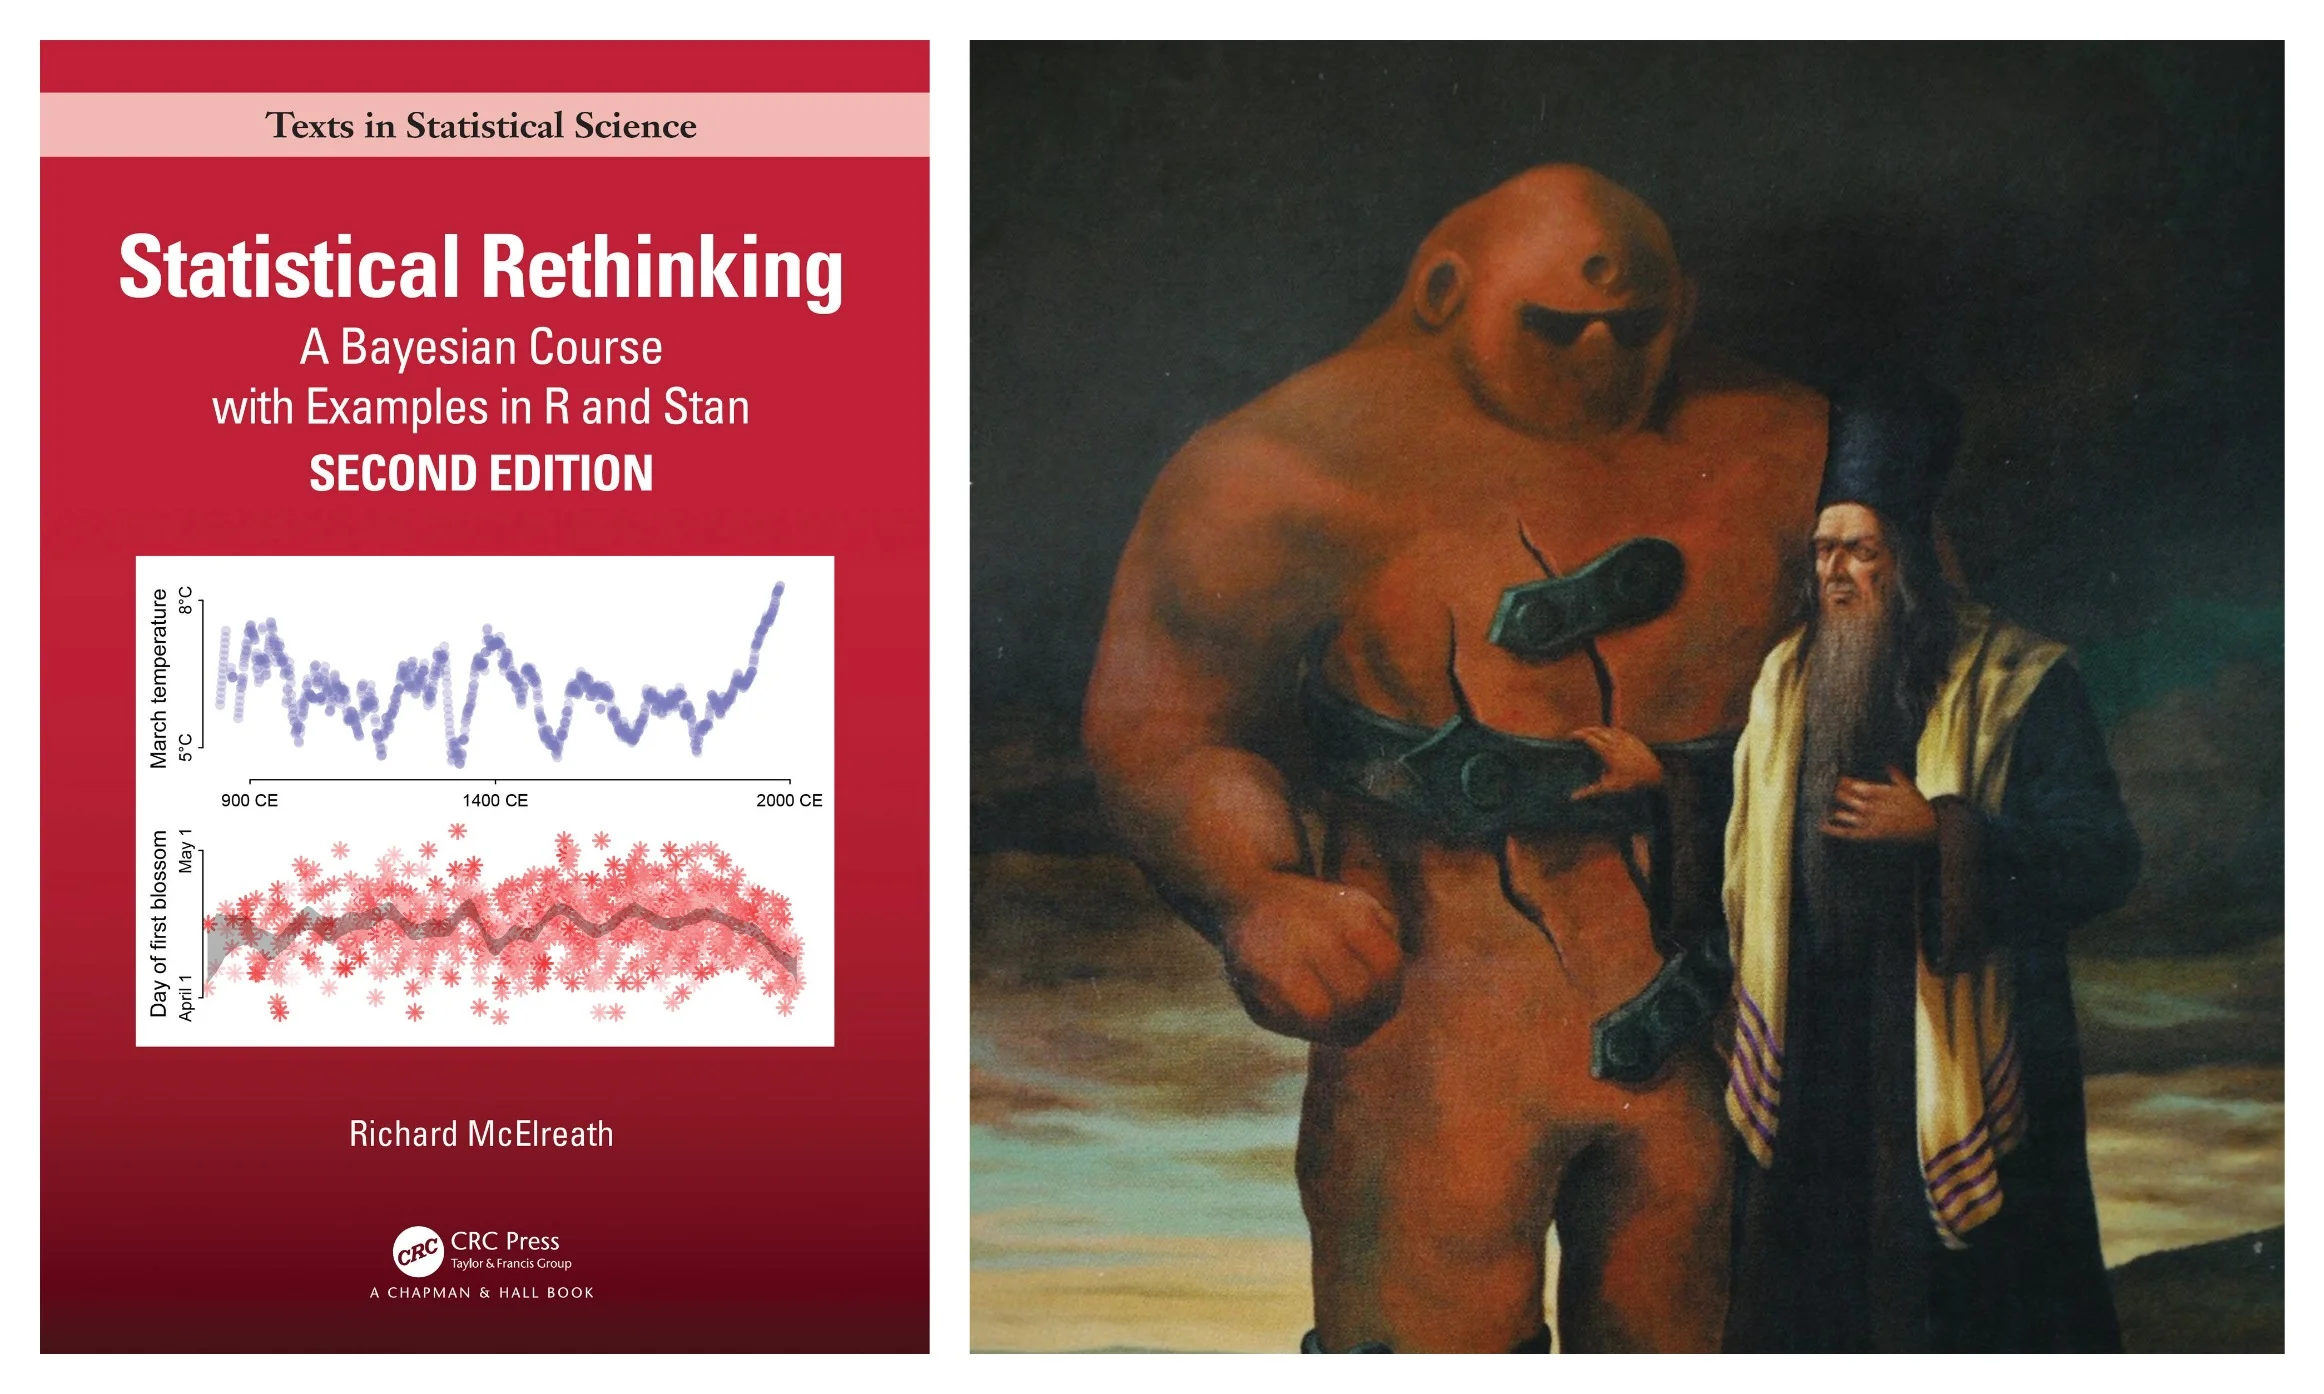
Richard McElreath’s Statistical Rethinking book beside an illustration of the Golem of Prague, warning that tools execute instructions without understanding intent.

Footnotes

  1. (Nuijten et al., Behavior Research Methods, 2016)

  2. (Aczel et al., AMPPS, 2018)

  3. Open Science Collaboration, Science, 2015