Grouped box/violin plots for between-subjects comparisons
Source:R/ggbetweenstats.R
grouped_ggbetweenstats.RdApplies ggbetweenstats() across all levels of grouping.var and combines
the resulting plots using combine_plots().
Arguments
- data
A data frame (or a tibble) from which variables specified are to be taken. Other data types (e.g., matrix, table, array, etc.) will not be accepted. Additionally, grouped data frames from
{dplyr}should be ungrouped before they are entered asdata.- ...
Arguments passed on to
ggbetweenstatsxlabLabel for
xaxis variable. IfNULL(default), variable name forxwill be used.ylabLabel for
yaxis variable. IfNULL(default), variable name forywill be used.p.adjust.methodAdjustment method for p-values for multiple comparisons. Possible methods are:
"holm"(default),"hochberg","hommel","bonferroni","BH","BY","fdr","none".pairwise.displayDecides which pairwise comparisons to display. Available options are:
"significant"(abbreviation accepted:"s")"non-significant"(abbreviation accepted:"ns")"all""none"
Use this to keep the plot uncluttered when many groups are compared. Pairwise comparisons are carried out (and displayed) only when
xhas three or more levels. Fortype = "bayes", there are no p-values, so all comparisons are displayed unless this is"none".pairwise.alphaNumeric alpha threshold used to decide which pairwise comparisons are displayed when
pairwise.display = "significant"orpairwise.display = "non-significant"(Default:0.05). It is compared against p-values adjusted usingp.adjust.method.bf.messageLogical that decides whether to display the Bayes Factor in favor of the null hypothesis as a caption. Relevant only for parametric tests (Default:
TRUE).results.subtitleLogical that decides whether the results of statistical tests are displayed as a subtitle (Default:
TRUE). Setting this toFALSEalso skips the automatic Bayes Factor caption. Other plot details have their own arguments.subtitleThe text for the plot subtitle. Used only if
results.subtitle = FALSE.captionThe text for the plot caption. It will be replaced by the Bayes Factor caption whenever that is displayed (see
bf.message).centrality.plottingLogical that decides whether central tendency measure is to be displayed as a point with a label (Default:
TRUE). Function decides which central tendency measure to show depending on thetypeargument.mean for parametric statistics
median for non-parametric statistics
trimmed mean for robust statistics
MAP estimator for Bayesian statistics
Use
centrality.typeto choose a different centrality measure.centrality.typeDecides which centrality measure is displayed. Defaults to the same value as
type. Can be one of:"parametric"(for mean)"nonparametric"(for median)"robust"(for trimmed mean)"bayes"(for MAP estimator)
As with
type, abbreviations are accepted.point.argsA list of additional aesthetic arguments passed to
ggplot2::geom_point().boxplot.argsA list of additional aesthetic arguments passed to
ggplot2::geom_boxplot(). By default, the whiskers extend to 1.5 times the interquartile range (IQR) from the box (Tukey-style). Usecoefto change this, e.g.,boxplot.args = list(coef = 3)extends the whiskers to the most extreme observations within 3 * IQR of the hinges.violin.argsA list of additional aesthetic arguments passed to
ggplot2::geom_violin().ggplot.componentA
{ggplot2}component, or a list of components, to add to the plot (Default:NULL). This is mostly helpful for thegrouped_variants, where it is applied to each individual plot.paletteName of the discrete palette in
"package::palette"format to be used for coloring (via{paletteer}). RunView(paletteer::palettes_d_names)to see all available options.centrality.point.args,centrality.label.argsA list of additional aesthetic arguments passed to
ggplot2::geom_point()andggrepel::geom_label_repel(), respectively, which display the centrality measure.ggsignif.argsA list of additional aesthetic arguments passed to
ggsignif::geom_signif().ggthemeA
{ggplot2}theme (Default:theme_ggstatsplot()). Any{ggplot2}theme (e.g.,ggplot2::theme_bw()) or theme from an extension package (e.g.,ggthemes::theme_fivethirtyeight()) can be used. Note that some themes remove plot details. For example,ggthemes::theme_fivethirtyeight()removes the secondary Y-axis, whichggbetweenstats()uses to show details about pairwise comparisons.xThe grouping (or independent) variable from
data.yThe response (or outcome or dependent) variable from
data.typeA character specifying the type of statistical approach:
"parametric""nonparametric""robust""bayes"
You can specify just the initial letter (e.g.
"np"or"bf"). Matching is on the initial lowercase letter only, so any other value (including capitalized values such as"Bayes") falls back to"parametric"without a warning.digitsNumber of digits for rounding or significant figures. May also be
"signif"to return significant figures or"scientific"to return scientific notation. Control the number of digits by adding the value as suffix, e.g.digits = "scientific4"to have scientific notation with 4 decimal places, ordigits = "signif5"for 5 significant figures (see alsosignif()).conf.levelScalar between
0and1(default:95%confidence/credible intervals,0.95).bf.priorA number between
0.5and2(default0.707), the prior width to use in calculating Bayes factors and posterior estimates. In addition to numeric arguments, several named values are also recognized:"medium","wide", and"ultrawide", corresponding to r scale values of1/2,sqrt(2)/2, and1, respectively. In case of an ANOVA, this value corresponds to scale for fixed effects.trTrim level for the mean when carrying out
robusttests. In case of an error, try reducing the value oftr, which is by default set to0.2. Lowering the value might help.alternativea character string specifying the alternative hypothesis, must be one of
"two.sided"(default),"greater"or"less". You can specify just the initial letter.
- grouping.var
A single grouping variable. A separate plot is created for each of its levels (in factor level order, or in order of appearance for character variables). Rows with a missing value in this variable are removed.
- plotgrid.args
A
listof additional arguments passed topatchwork::wrap_plots(), except forguides, which has its own argument.- annotation.args
A
listof additional arguments passed topatchwork::plot_annotation().
Value
A patchwork object combining one plot per level of
grouping.var (see combine_plots()). Applying extract_stats() to
it returns a list with the statistical details for each of these plots.
Examples
# for reproducibility
set.seed(123)
library(dplyr, warn.conflicts = FALSE)
library(ggplot2)
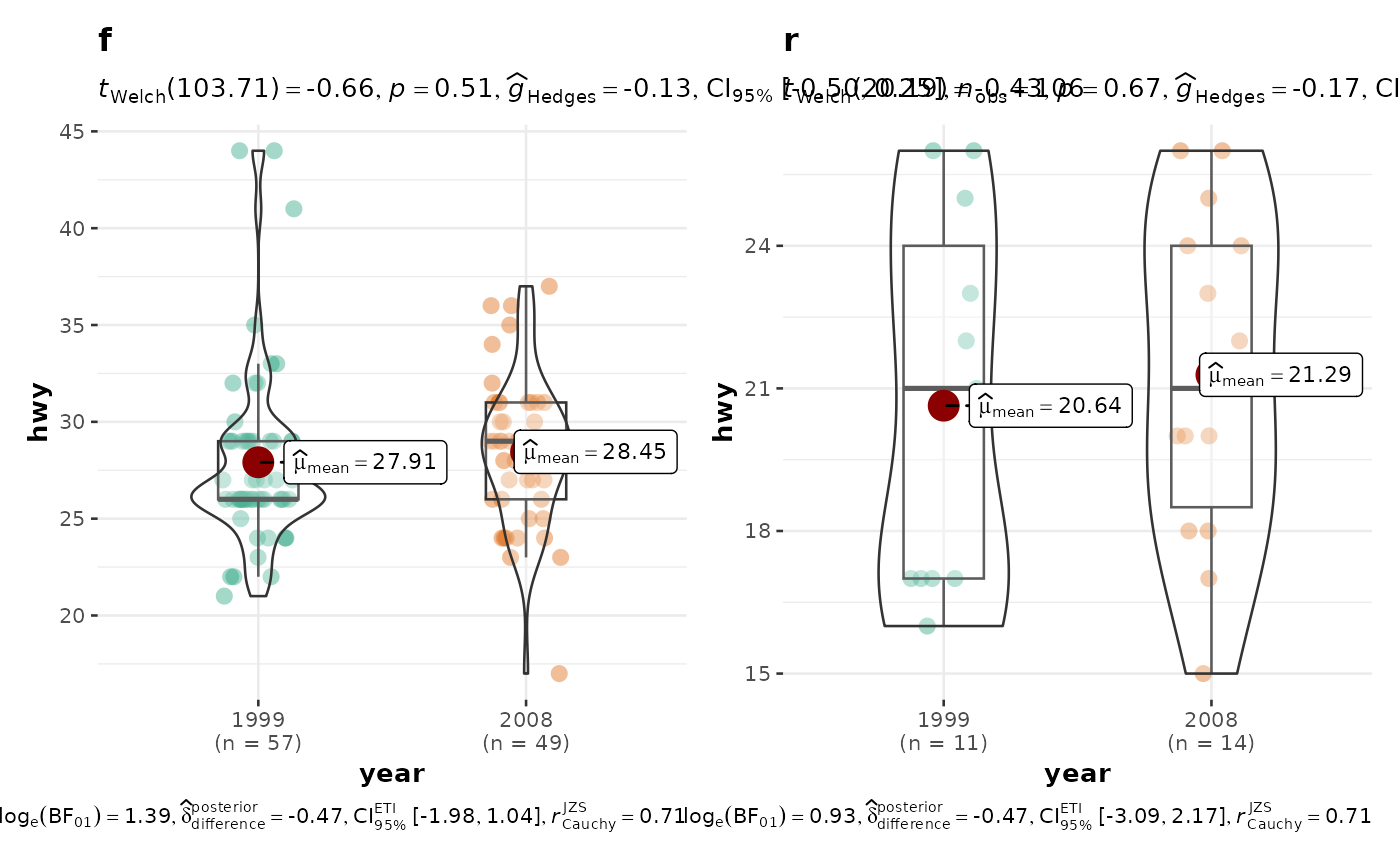
grouped_ggbetweenstats(
data = filter(ggplot2::mpg, drv != "4"),
x = year,
y = hwy,
grouping.var = drv
)
 # modifying individual plots using `ggplot.component` argument
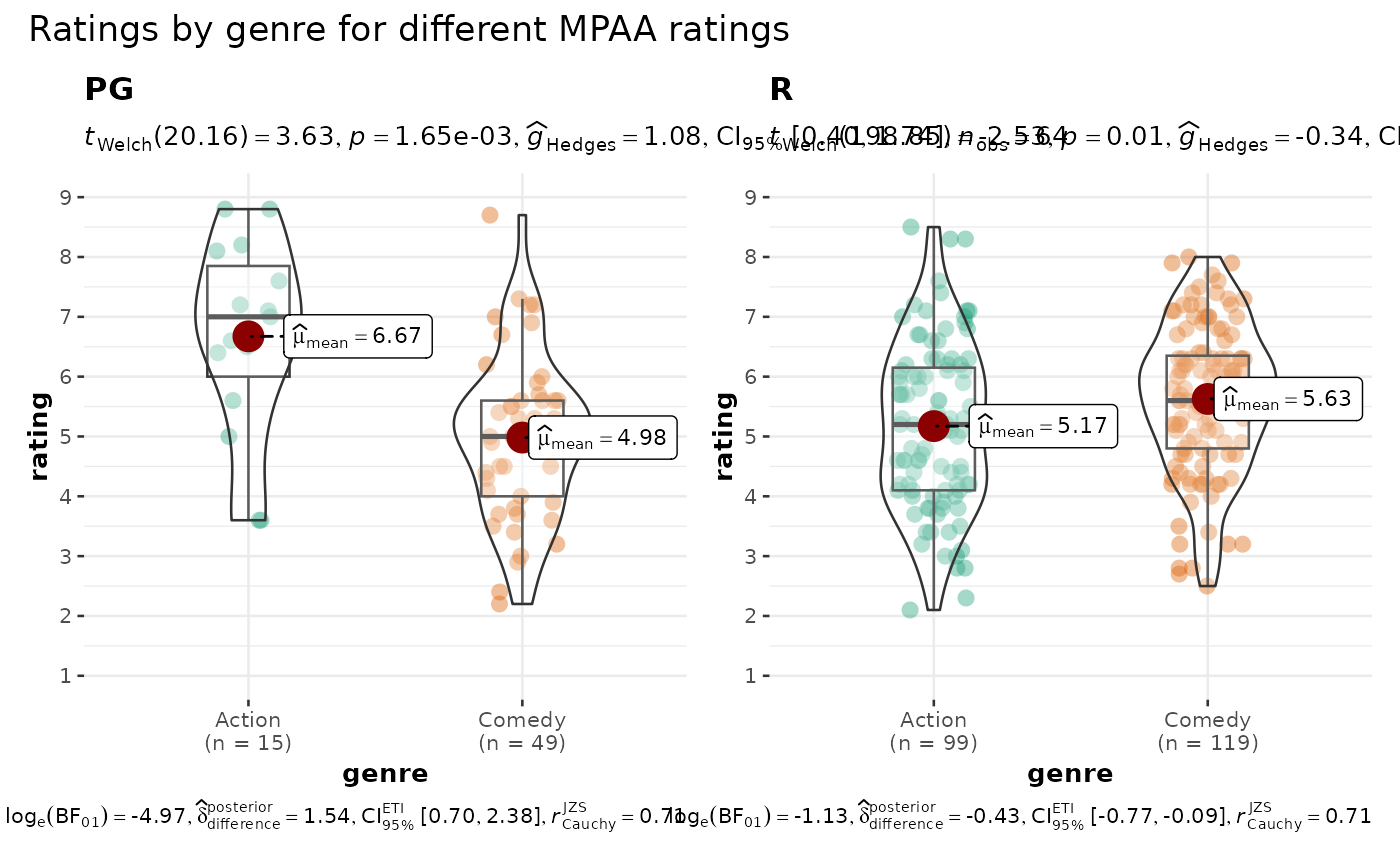
grouped_ggbetweenstats(
data = filter(
movies_long,
genre %in% c("Action", "Comedy"),
mpaa %in% c("R", "PG")
),
x = genre,
y = rating,
grouping.var = mpaa,
ggplot.component = scale_y_continuous(
breaks = seq(1, 9, 1),
limits = c(1, 9)
),
annotation.args = list(title = "Ratings by genre for different MPAA ratings")
)
#> Scale for y is already present.
#> Adding another scale for y, which will replace the existing scale.
#> Scale for y is already present.
#> Adding another scale for y, which will replace the existing scale.