Lifecycle: 
The function ggdotplotstats can be used for data
exploration and to provide an easy way to make
publication-ready dot plots/charts with appropriate and
selected statistical details embedded in the plot itself. In this
vignette, we will explore several examples of how to use it.
This function is a sister function of gghistostats with
the difference being it expects a labeled numeric variable: a numeric
variable (x) along with a variable containing labels
(y). If there are multiple observations per label, they are
first summarized into a single centrality measure per label (mean,
median, trimmed mean, or MAP estimate, depending on type),
shown as a dot with its confidence interval. The one-sample test is then
carried out on these per-label summaries, i.e., the sample size is the
number of labels.
Distribution of a sample with ggdotplotstats
Let’s begin with a very simple example from the
ggplot2 package (ggplot2::mpg), a subset of
the fuel economy data that the EPA makes available on https://fueleconomy.gov.
dplyr::glimpse(ggplot2::mpg)
#> Rows: 234
#> Columns: 11
#> $ manufacturer <chr> "audi", "audi", "audi", "audi", "audi", "audi", "audi", "…
#> $ model        <chr> "a4", "a4", "a4", "a4", "a4", "a4", "a4", "a4 quattro", "…
#> $ displ        <dbl> 1.8, 1.8, 2.0, 2.0, 2.8, 2.8, 3.1, 1.8, 1.8, 2.0, 2.0, 2.…
#> $ year         <int> 1999, 1999, 2008, 2008, 1999, 1999, 2008, 1999, 1999, 200…
#> $ cyl          <int> 4, 4, 4, 4, 6, 6, 6, 4, 4, 4, 4, 6, 6, 6, 6, 6, 6, 8, 8, …
#> $ trans        <chr> "auto(l5)", "manual(m5)", "manual(m6)", "auto(av)", "auto…
#> $ drv          <chr> "f", "f", "f", "f", "f", "f", "f", "4", "4", "4", "4", "4…
#> $ cty          <int> 18, 21, 20, 21, 16, 18, 18, 18, 16, 20, 19, 15, 17, 17, 1…
#> $ hwy          <int> 29, 29, 31, 30, 26, 26, 27, 26, 25, 28, 27, 25, 25, 25, 2…
#> $ fl           <chr> "p", "p", "p", "p", "p", "p", "p", "p", "p", "p", "p", "p…
#> $ class        <chr> "compact", "compact", "compact", "compact", "compact", "c…
Let’s say we want to visualize the distribution of mileage by car manufacturer.
## keeping only the two most common cylinder types
df <- dplyr::filter(ggplot2::mpg, cyl %in% c("4", "6"))

## one color per manufacturer from a `{paletteer}` palette
palette_vector <- paletteer::paletteer_d(
  palette = "palettetown::venusaur",
  n = dplyr::n_distinct(df$manufacturer)
)

ggdotplotstats(
  data = df,
  x = cty,
  y = manufacturer,
  xlab = "city miles per gallon",
  ylab = "car manufacturer",
  test.value = 15.5,
  point.args = list(
    shape = 16,
    color = palette_vector,
    size = 5
  ),
  title = "Distribution of mileage of cars",
  ggtheme = ggplot2::theme_dark()
)
Grouped analysis with grouped_ggdotplotstats
What if we want to do the same analysis separately for different engines with different numbers of cylinders?
ggstatsplot provides a special helper function for
such instances: grouped_ggdotplotstats. This is merely a
wrapper function around combine_plots. It applies
ggdotplotstats across all levels of a
specified grouping variable and then combines the
individual plots into a single plot. Note that the grouping variable can
be anything: conditions in a given study, groups in a study sample,
different studies, etc.
Let’s see how we can use this function to apply
ggdotplotstats to accomplish our task.
grouped_ggdotplotstats(
  ## arguments relevant for ggdotplotstats
  data = df,
  grouping.var = cyl, ## grouping variable
  x = cty,
  y = manufacturer,
  xlab = "city miles per gallon",
  ylab = "car manufacturer",
  type = "bayes",
  test.value = 15.5,
  ## arguments relevant for `combine_plots`
  annotation.args = list(title = "Fuel economy data"),
  plotgrid.args = list(nrow = 2L)
)
Grouped analysis with {purrr}
For group-specific arguments or multiple grouping variables, see the programmatic plotting article. It explains how to split the data, customize each call, and combine the resulting plots.
Summary of graphics and tests
| graphical element |
geom used |
argument for further modification |
|---|---|---|
| point estimates | ggplot2::geom_point() |
point.args |
| error bars | ggplot2::geom_errorbar() |
errorbar.args |
| centrality measure line | ggplot2::geom_vline() |
centrality.line.args |
The statistical tests and effect sizes carried out for each
type are listed in the function documentation: https://www.indrapatil.com/ggstatsplot/reference/ggdotplotstats.html
Extracting statistical details
Use extract_stats()
to retrieve the results as data frames; its reference page describes all
returned components, including the lists returned for
grouped_ plots.
p <- ggdotplotstats(morley, Speed, Expt, test.value = 800)
p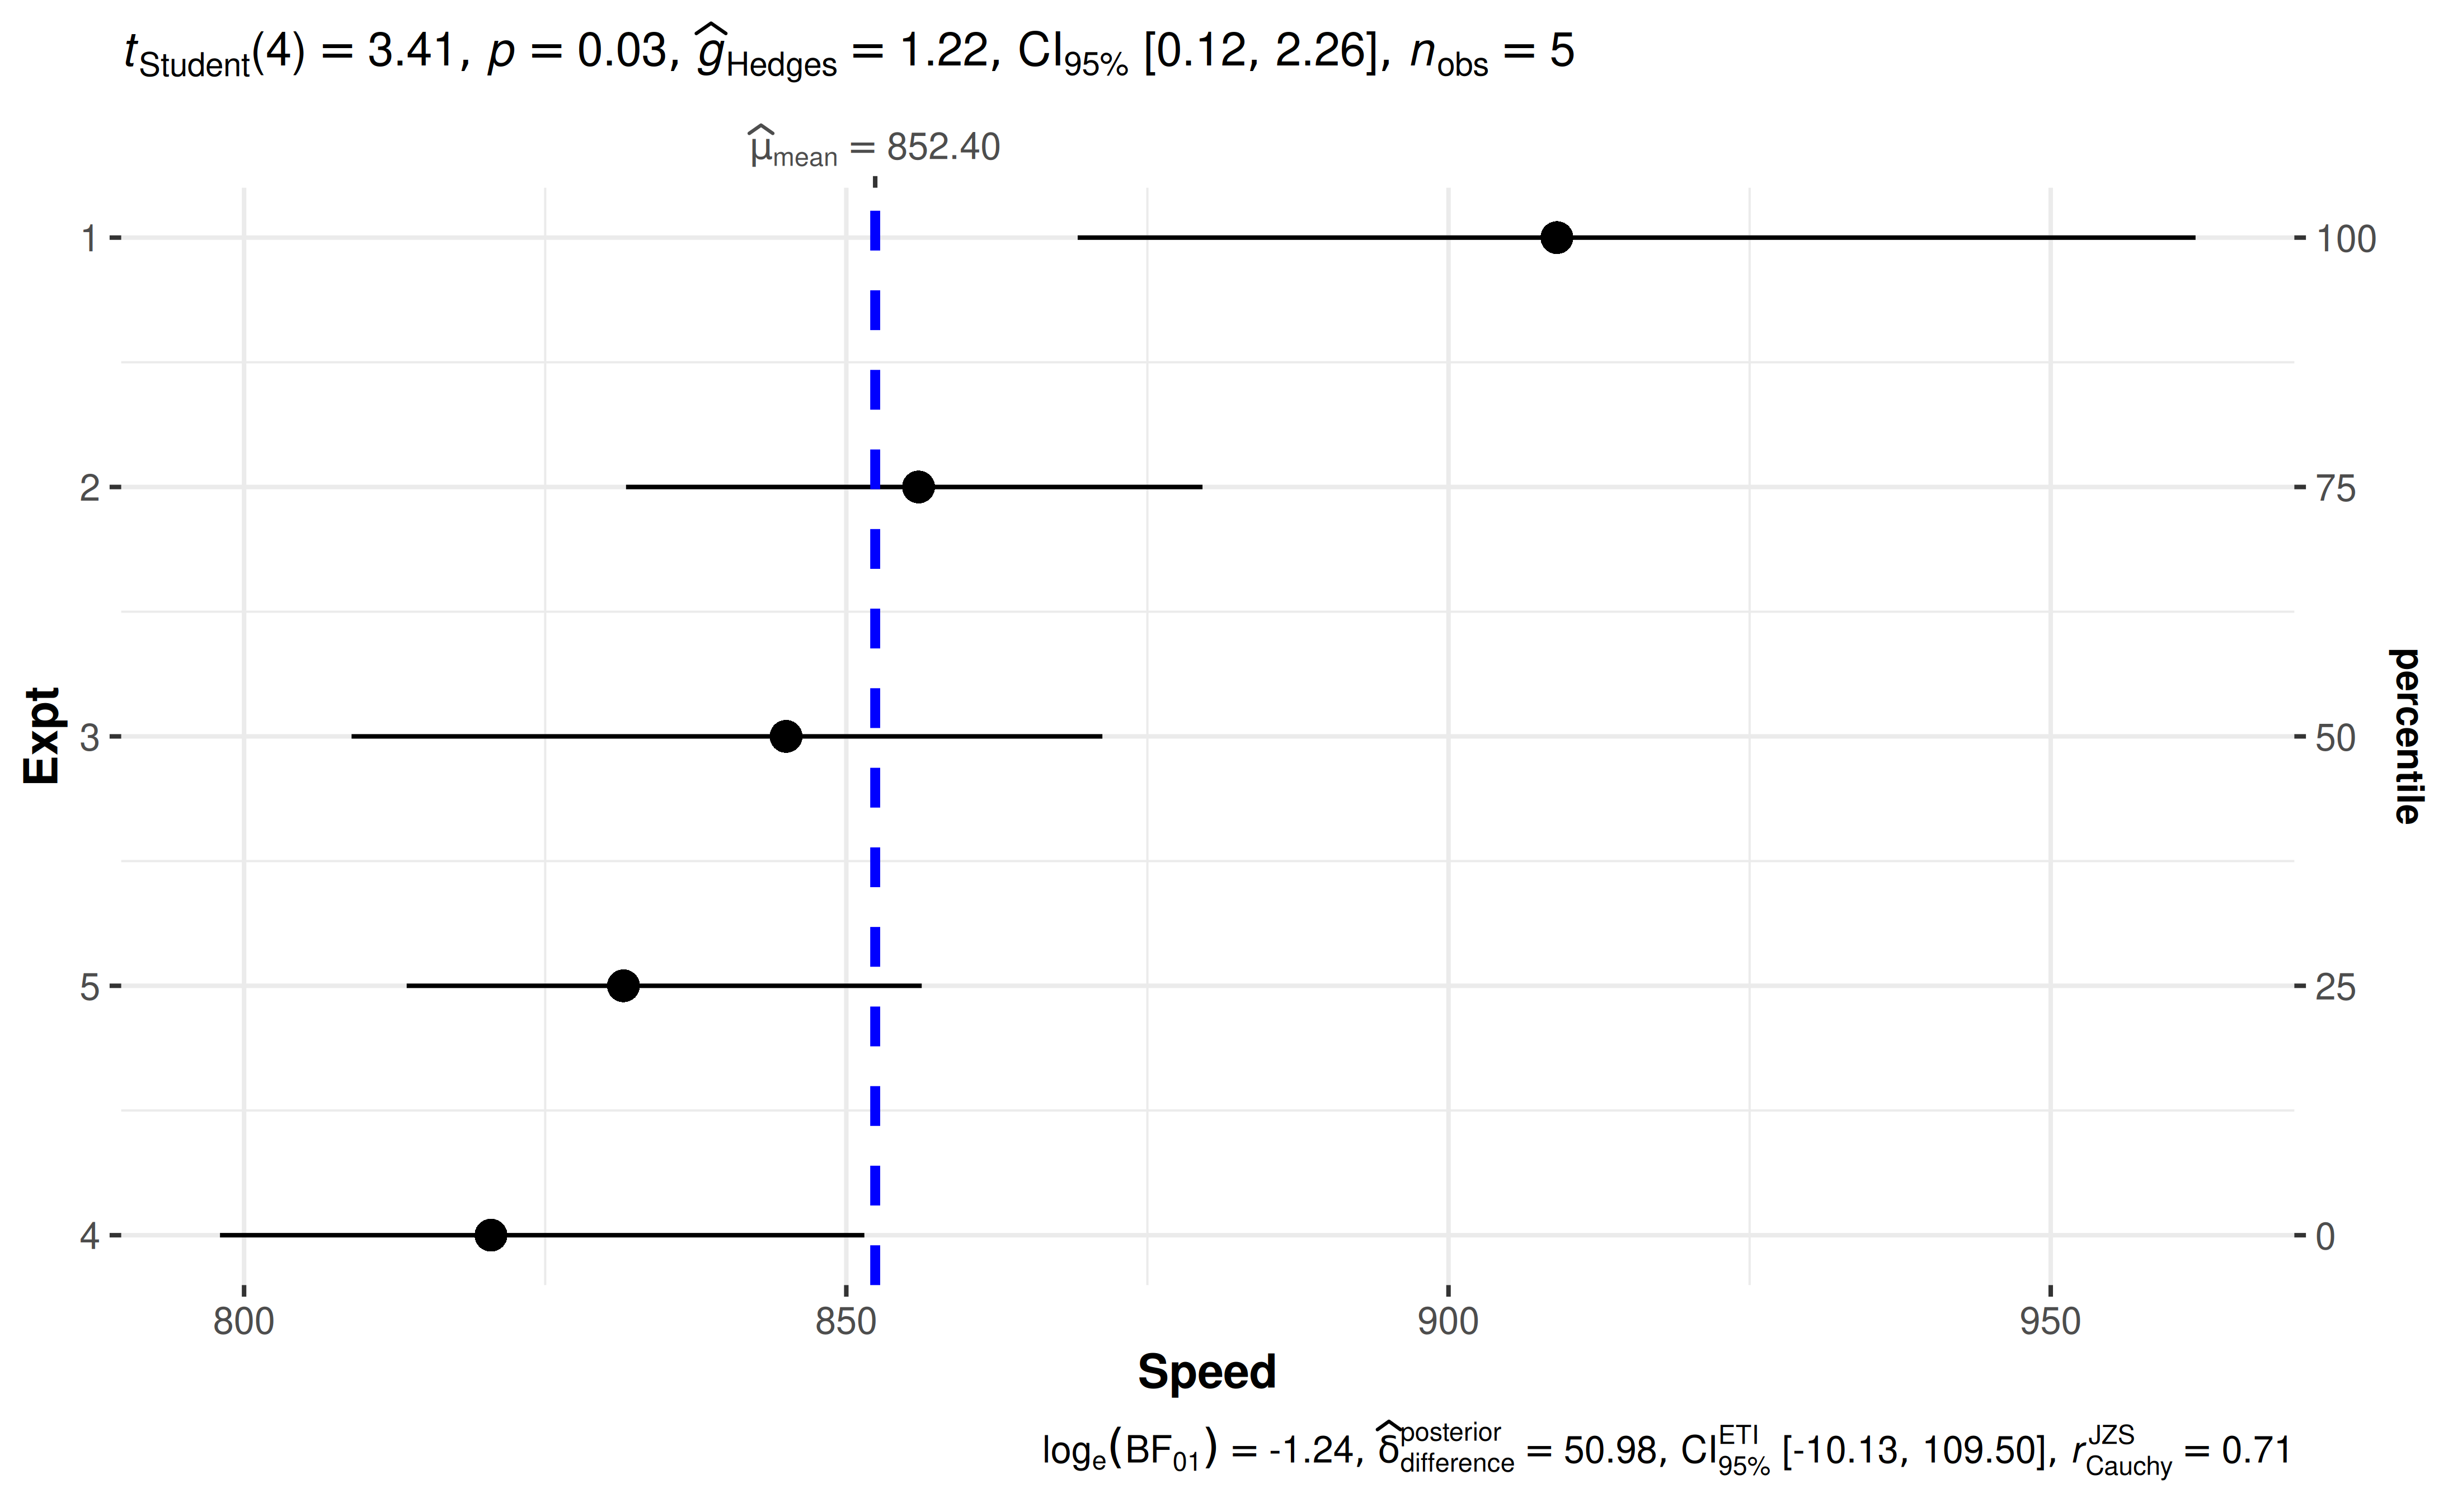
extract_stats(p)$subtitle_data
#> # A tibble: 1 × 15
#>      mu statistic df.error p.value method            alternative effectsize
#>   <dbl>     <dbl>    <dbl>   <dbl> <chr>             <chr>       <chr>
#> 1   800      3.41        4  0.0271 One Sample t-test two.sided   Hedges' g
#>   estimate conf.level conf.low conf.high conf.method conf.distribution n.obs
#>      <dbl>      <dbl>    <dbl>     <dbl> <chr>       <chr>             <int>
#> 1     1.22       0.95    0.119      2.26 ncp         t                     5
#>   expression
#>   <list>
#> 1 <language>
Reporting
If you wish to include statistical analysis results in a publication/report, the ideal reporting practice will be a hybrid of two approaches:
the ggstatsplot approach, where the plot contains both the visual and numerical summaries about a statistical model, and
the standard narrative approach, which provides interpretive context for the reported statistics.
For the example above, the narrative context could read:
Student’s t-test revealed that, across 5 experiments, the speed of light was significantly different than posited speed. The effect size was very large, as per Cohen’s (1988) conventions. The Bayes Factor for the same analysis revealed that the data were 3.46 times more probable under the alternative hypothesis as compared to the null hypothesis. This can be considered moderate evidence (Jeffreys, 1961) in favor of the alternative hypothesis.
Suggestions
If you find any bugs or have any suggestions/remarks, please file an issue on GitHub: https://github.com/IndrajeetPatil/ggstatsplot/issues
Citation
You can cite this package/vignette as:
To cite package 'ggstatsplot' in publications use:

  Patil, I. (2021). Visualizations with statistical details: The
  'ggstatsplot' approach. Journal of Open Source Software, 6(61), 3167,
  doi:10.21105/joss.03167

A BibTeX entry for LaTeX users is

  @Article{,
    doi = {10.21105/joss.03167},
    url = {https://doi.org/10.21105/joss.03167},
    year = {2021},
    publisher = {{The Open Journal}},
    volume = {6},
    number = {61},
    pages = {3167},
    author = {Indrajeet Patil},
    title = {{Visualizations with statistical details: The {'ggstatsplot'} approach}},
    journal = {{Journal of Open Source Software}},
  }