Lifecycle: 
The function ggcoefstats generates
dot-and-whisker plots for regression models (or for
data frames containing estimates). For model objects, the tidy data
frames are prepared using parameters::model_parameters().
Additionally, if available, the model summary indices are also extracted
from performance::model_performance().
Unlike other ggstatsplot functions,
ggcoefstats() does not have a type argument or
a grouped_ variant. Instead, it has model-specific controls
such as effectsize.type (for ANOVA-type models),
meta.analytic.effect and meta.type (for
meta-analysis), sort (to order the terms by their
estimates), and only.significant (to label only significant
terms).
In this vignette, we will see examples of how to use this function. We will try to cover as many classes of objects as possible. Unfortunately, there is no single dataset that will be helpful for carrying out all types of regression analyses and, therefore, we will use various datasets to explore data-specific hypotheses using regression models.
General structure of the plots
Although the statistical models displayed in the plot may differ based on the class of models being investigated, there are a few aspects of the plot that will be invariant across models:
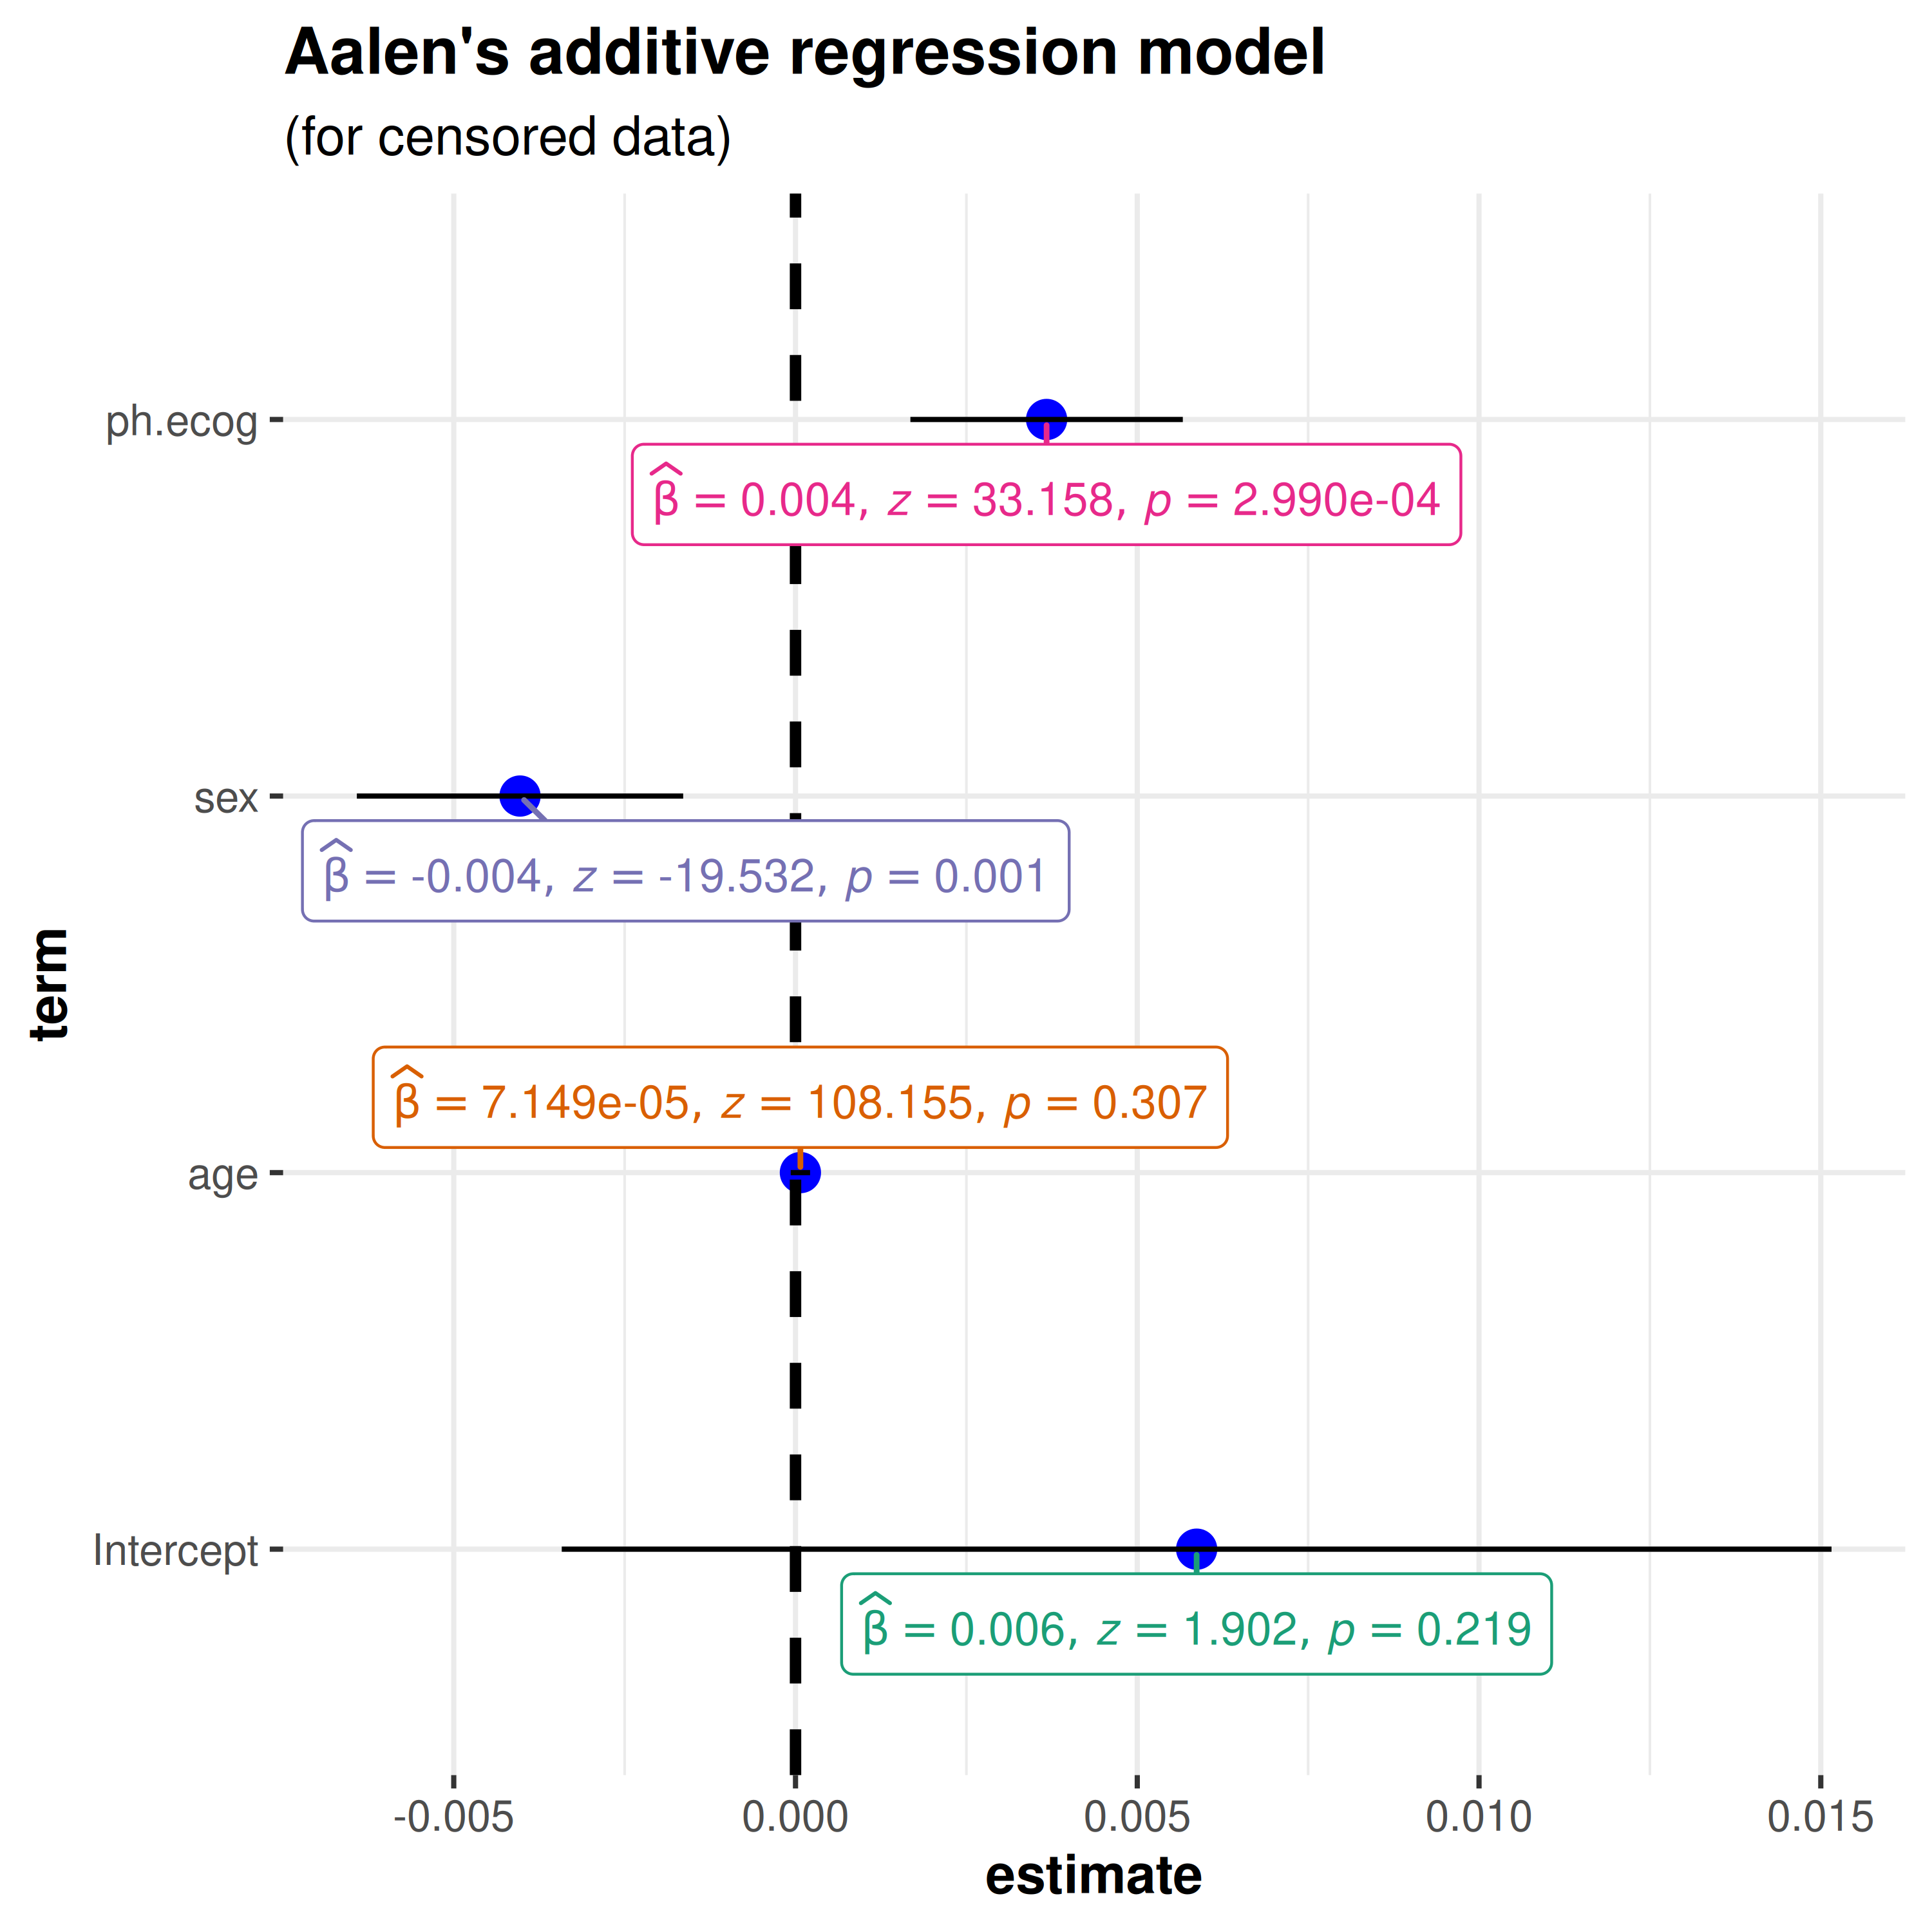
The dot-whisker plot contains a dot representing the estimate and their confidence intervals (
95%is the default). The estimate can either be effect sizes (for tests that depend on theF-statistic) or regression coefficients (for tests witht-, -, andz-statistic), etc. The confidence intervals can sometimes be asymmetric if bootstrapping was used.The label attached to each dot will provide more details from the statistical test carried out and it will typically contain estimate, statistic, and p-value.
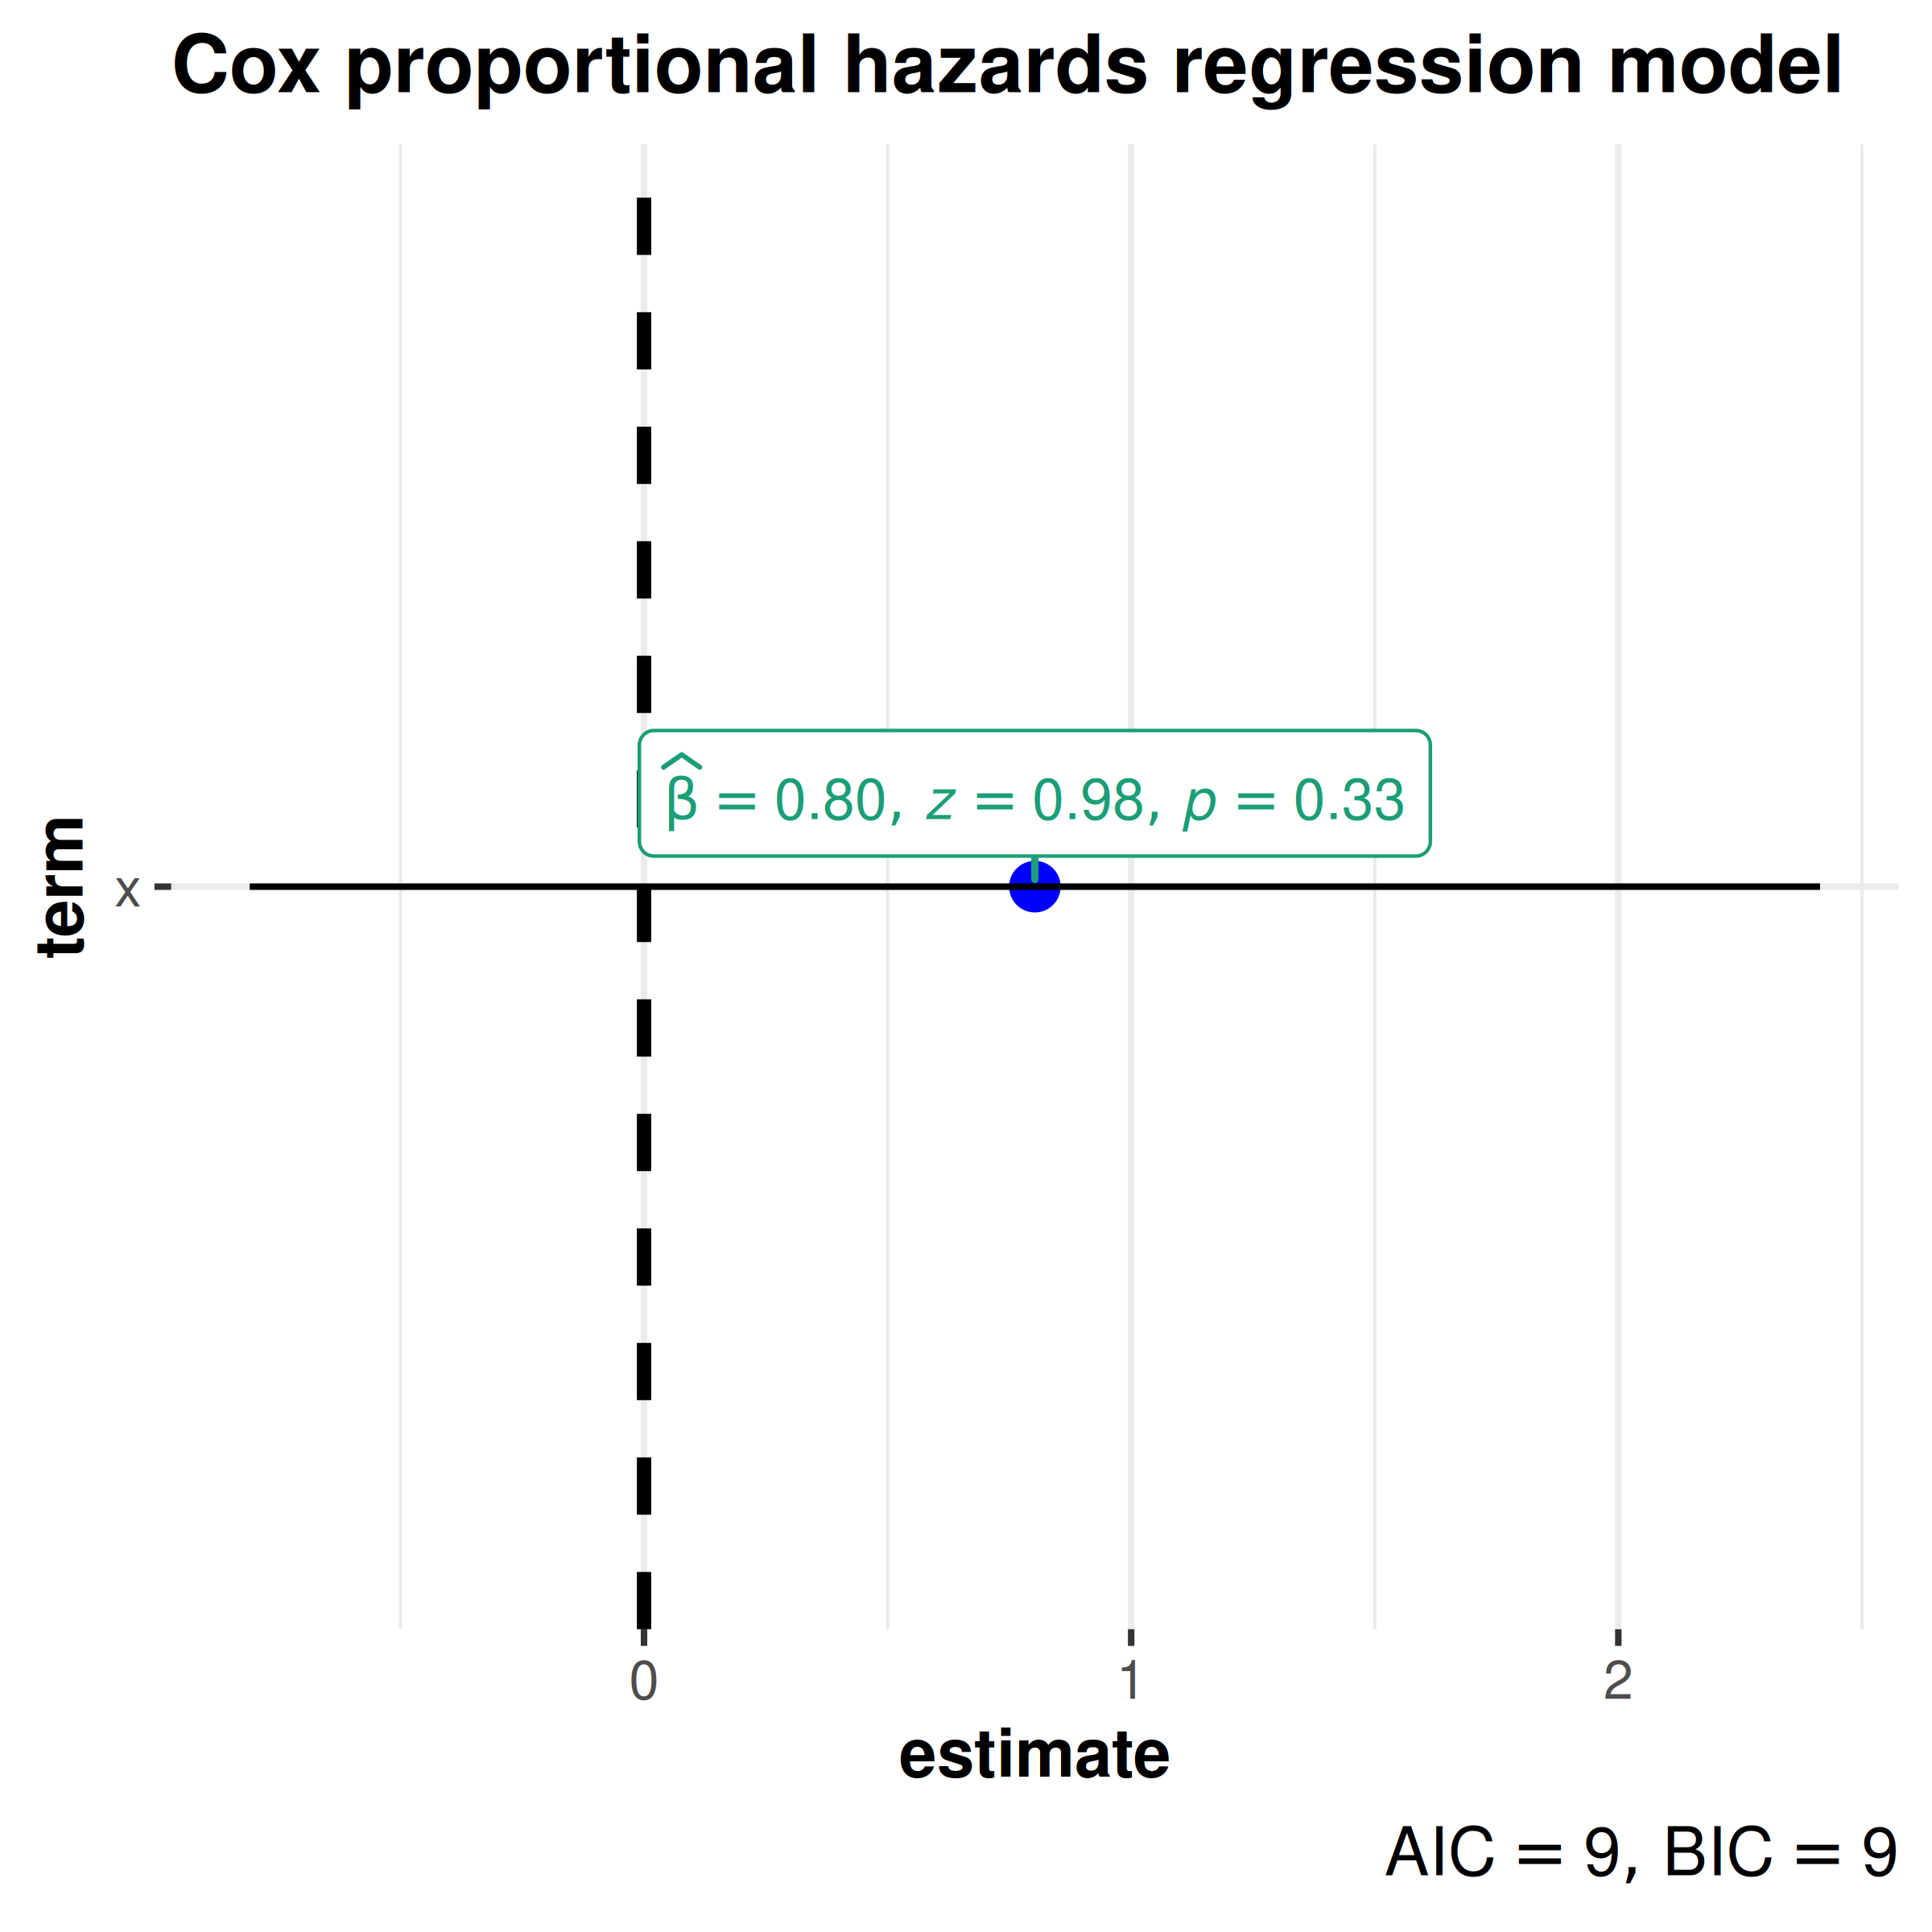
The caption will contain diagnostic information, if available, about models that can be useful for model selection: The smaller the Akaike’s Information Criterion (AIC) and the Bayesian Information Criterion (BIC) values, the “better” the model is.
The output of this function will be a ggplot2 object and, thus, it can be further modified (e.g., change themes, etc.) with ggplot2 functions.
Supported models
Most of the regression models that are supported in the underlying
packages are also supported by ggcoefstats().
insight::supported_models()
#>   [1] "aareg"                   "afex_aov"
#>   [3] "AKP"                     "Anova.mlm"
#>   [5] "anova.rms"               "aov"
#>   [7] "aovlist"                 "Arima"
#>   [9] "asym"                    "averaging"
#>  [11] "bamlss"                  "bamlss.frame"
#>  [13] "bayesQR"                 "bayesx"
#>  [15] "BBmm"                    "BBreg"
#>  [17] "bcplm"                   "betamfx"
#>  [19] "betaor"                  "betareg"
#>  [21] "BFBayesFactor"           "bfsl"
#>  [23] "BGGM"                    "bife"
#>  [25] "bifeAPEs"                "bigglm"
#>  [27] "biglm"                   "blavaan"
#>  [29] "blrm"                    "bracl"
#>  [31] "brglm"                   "brmsfit"
#>  [33] "brmultinom"              "btergm"
#>  [35] "censReg"                 "cgam"
#>  [37] "cgamm"                   "cglm"
#>  [39] "clm"                     "clm2"
#>  [41] "clmm"                    "clmm2"
#>  [43] "clogit"                  "coeftest"
#>  [45] "complmrob"               "confusionMatrix"
#>  [47] "coxme"                   "coxph"
#>  [49] "coxph_weightit"          "coxph.penal"
#>  [51] "coxr"                    "cpglm"
#>  [53] "cpglmm"                  "crch"
#>  [55] "crq"                     "crqs"
#>  [57] "crr"                     "dep.effect"
#>  [59] "DirichletRegModel"       "draws"
#>  [61] "drc"                     "eglm"
#>  [63] "elm"                     "emmGrid"
#>  [65] "epi.2by2"                "ergm"
#>  [67] "estimate_contrasts"      "estimate_means"
#>  [69] "estimate_slopes"         "externVar"
#>  [71] "externX"                 "fdm"
#>  [73] "feglm"                   "feis"
#>  [75] "felm"                    "fitdistr"
#>  [77] "fixest"                  "flac"
#>  [79] "flexsurvreg"             "flic"
#>  [81] "gam"                     "Gam"
#>  [83] "gamlss"                  "gamm"
#>  [85] "gamm4"                   "garch"
#>  [87] "gbm"                     "gee"
#>  [89] "geeglm"                  "ggcomparisons"
#>  [91] "glht"                    "glimML"
#>  [93] "glm"                     "Glm"
#>  [95] "glm_weightit"            "glmerMod"
#>  [97] "glmgee"                  "glmm"
#>  [99] "glmmadmb"                "glmmPQL"
#> [101] "glmmTMB"                 "glmrob"
#> [103] "glmRob"                  "glmx"
#> [105] "gls"                     "gmnl"
#> [107] "hglm"                    "HLfit"
#> [109] "htest"                   "hurdle"
#> [111] "iv_robust"               "ivFixed"
#> [113] "ivprobit"                "ivreg"
#> [115] "joint"                   "lavaan"
#> [117] "lcmm"                    "lm"
#> [119] "lm_robust"               "lme"
#> [121] "lmerMod"                 "lmerModLmerTest"
#> [123] "lmodel2"                 "lmrob"
#> [125] "lmRob"                   "logistf"
#> [127] "logitmfx"                "logitor"
#> [129] "logitr"                  "LORgee"
#> [131] "lqm"                     "lqmm"
#> [133] "lrm"                     "manova"
#> [135] "MANOVA"                  "marginaleffects"
#> [137] "marginaleffects.summary" "margins"
#> [139] "maxLik"                  "mblogit"
#> [141] "mclogit"                 "mcmc"
#> [143] "mcmc.list"               "MCMCglmm"
#> [145] "mcp1"                    "mcp12"
#> [147] "mcp2"                    "med1way"
#> [149] "mediate"                 "merMod"
#> [151] "merModList"              "meta_bma"
#> [153] "meta_fixed"              "meta_random"
#> [155] "metaplus"                "mhurdle"
#> [157] "mipo"                    "mira"
#> [159] "mixed"                   "MixMod"
#> [161] "mixor"                   "mjoint"
#> [163] "mle"                     "mle2"
#> [165] "mlm"                     "mlogit"
#> [167] "mmclogit"                "mmlogit"
#> [169] "mmrm"                    "mmrm_fit"
#> [171] "mmrm_tmb"                "model_fit"
#> [173] "multinom"                "multinom_weightit"
#> [175] "mvord"                   "negbinirr"
#> [177] "negbinmfx"               "nestedLogit"
#> [179] "nlme"                    "ols"
#> [181] "onesampb"                "oohbchoice"
#> [183] "ordinal_weightit"        "orm"
#> [185] "pgmm"                    "phyloglm"
#> [187] "phylolm"                 "plm"
#> [189] "PMCMR"                   "poissonirr"
#> [191] "poissonmfx"              "polr"
#> [193] "probitmfx"               "psm"
#> [195] "Rchoice"                 "ridgelm"
#> [197] "riskRegression"          "rjags"
#> [199] "rlm"                     "rlmerMod"
#> [201] "RM"                      "rma"
#> [203] "rma.uni"                 "rms"
#> [205] "robmixglm"               "robtab"
#> [207] "rq"                      "rqs"
#> [209] "rqss"                    "rvar"
#> [211] "Sarlm"                   "scam"
#> [213] "sdmTMB"                  "selection"
#> [215] "sem"                     "SemiParBIV"
#> [217] "semLm"                   "semLme"
#> [219] "seqanova.svyglm"         "serp"
#> [221] "slm"                     "speedglm"
#> [223] "speedlm"                 "stanfit"
#> [225] "stanmvreg"               "stanreg"
#> [227] "summary.lm"              "survfit"
#> [229] "survreg"                 "svy_vglm"
#> [231] "svy2lme"                 "svychisq"
#> [233] "svycoxph"                "svyglm"
#> [235] "svyolr"                  "svysurvreg"
#> [237] "systemfit"               "t1way"
#> [239] "tobit"                   "trimcibt"
#> [241] "truncreg"                "vgam"
#> [243] "vglm"                    "wbgee"
#> [245] "wblm"                    "wbm"
#> [247] "wmcpAKP"                 "yuen"
#> [249] "yuend"                   "zcpglm"
#> [251] "zeroinfl"                "zerotrunc"
Examples of supported models
The following examples are organized by statistics type.
There used to be a much longer vignette with examples of a wide collection of regression models, but for the sake of maintainability, I have removed it. The old version can be found here.
t-statistic
linear model (lm) and linear mixed-effects model
(lmer/lmerMod)
library(lme4)

# lm model
mod1 <- stats::lm(formula = Reaction ~ Days, data = sleepstudy)

# merMod model
mod2 <- lme4::lmer(Reaction ~ Days + (Days | Subject), sleepstudy)

# combining the two different plots
combine_plots(
  plotlist = list(
    ggcoefstats(mod1) +
      ggplot2::labs(x = parse(text = "'regression coefficient' ~italic(beta)")),
    ggcoefstats(mod2) +
      ggplot2::labs(x = parse(text = "'regression coefficient' ~italic(beta)"))
  ),
  plotgrid.args = list(nrow = 2L),
  annotation.args = list(title = "Relationship between reaction time and sleep deprivation")
)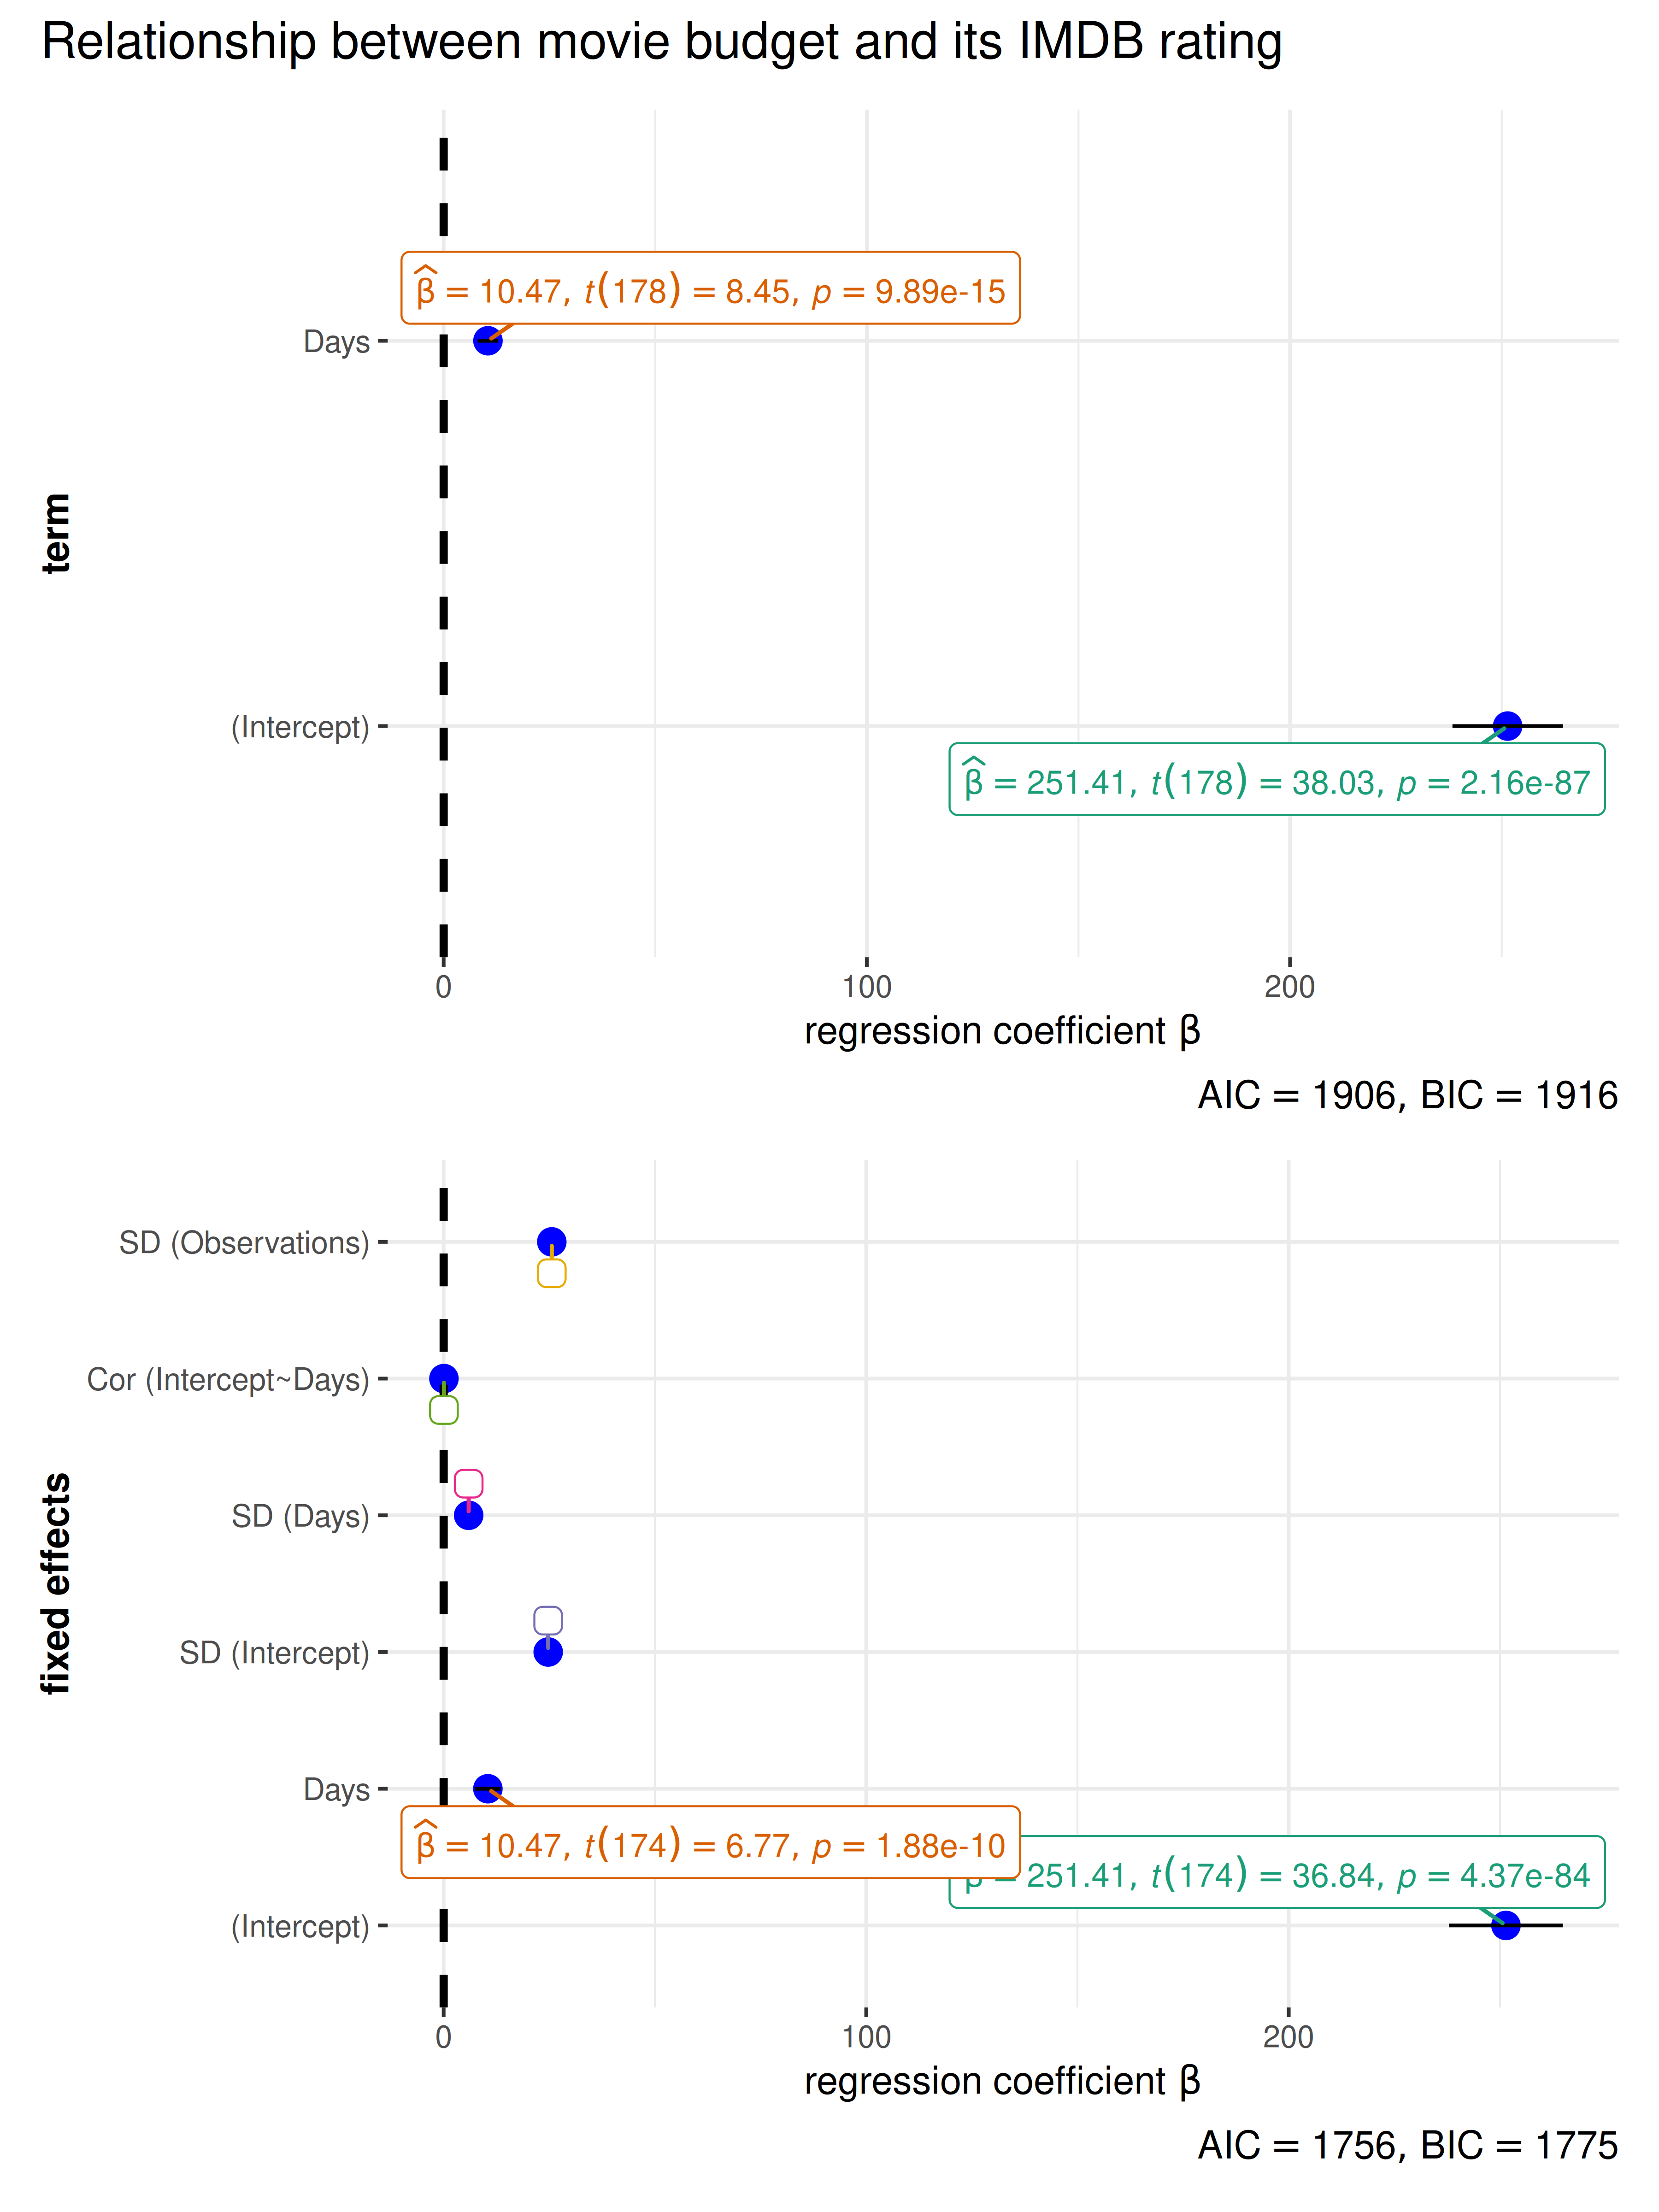
Note that, for mixed-effects models, the random effects variance
components (e.g., SD (Intercept)) are also shown, but
without statistical details or confidence intervals, because these are
not computed by parameters::model_parameters() by default.
For more details about these terms, you can use
parameters::model_parameters() directly.
z-statistic
Aalen’s additive regression model for censored data
(aareg)
library(survival)

# model
afit <- survival::aareg(
  formula = Surv(time, status) ~ age + sex + ph.ecog,
  data = lung,
  dfbeta = TRUE
)

ggcoefstats(
  x = afit,
  title = "Aalen's additive regression model",
  subtitle = "(for censored data)",
  digits = 3
)
-statistic
Cox proportional hazards regression model (coxph)
# create the simplest-test data set
test1 <- list(
  time = c(4, 3, 1, 1, 2, 2, 3),
  status = c(1, 1, 1, 0, 1, 1, 0),
  x = c(0, 2, 1, 1, 1, 0, 0),
  sex = c(0, 0, 0, 0, 1, 1, 1)
)

# fit a stratified model
mod_coxph <-
  survival::coxph(
    formula = Surv(time, status) ~ x + strata(sex),
    data = test1
  )

ggcoefstats(
  x = mod_coxph,
  title = "Cox proportional hazards regression model"
)
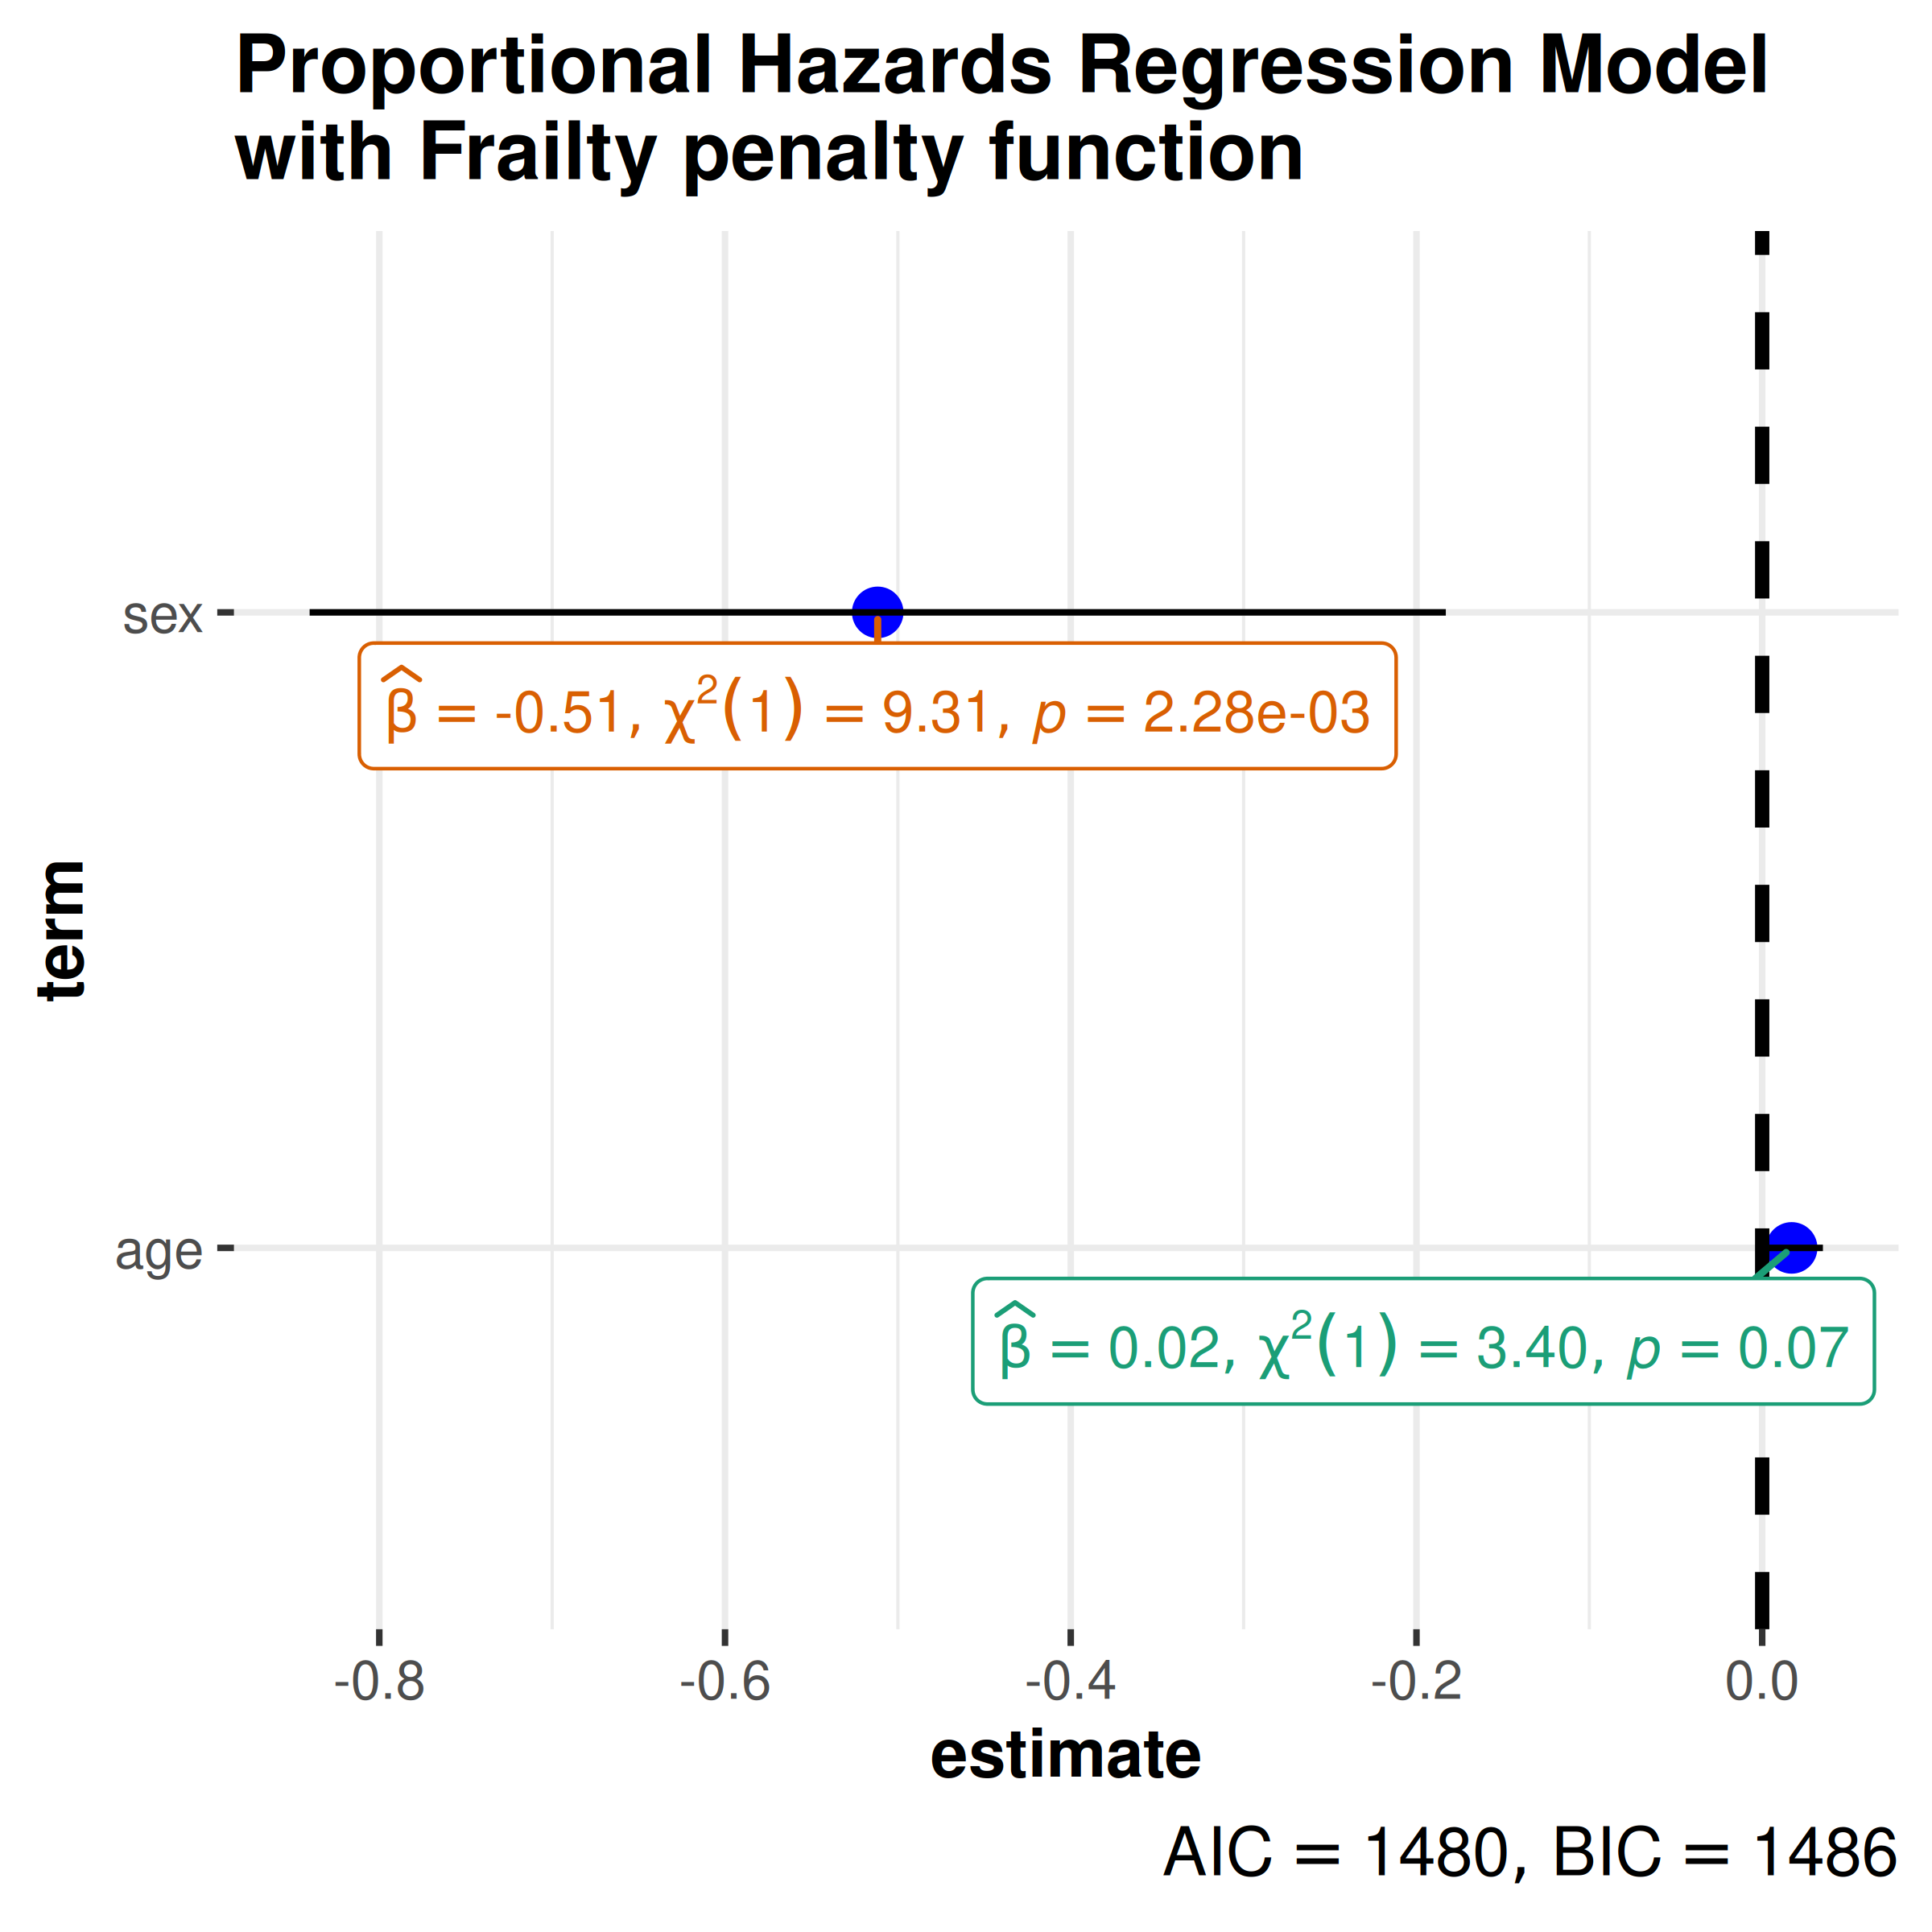
Another example with frailty term.
# model
mod_coxph <- survival::coxph(
  formula = Surv(time, status) ~ age + sex + frailty(inst),
  data = lung
)

ggcoefstats(
  x = mod_coxph,
  title = "Proportional Hazards Regression Model\nwith Frailty penalty function"
)
F-statistic
omnibus ANOVA (aov)
mod_aov <- stats::aov(formula = rating ~ mpaa * genre, data = movies_long)

ggcoefstats(
  x = mod_aov,
  effectsize.type = "eta", # changing the effect size estimate being displayed
  point.args = list(color = "red", size = 4, shape = 15), # changing the point geom
  palette = "dutchmasters::milkmaid", # color palette for labels
  title = "omnibus ANOVA", # title for the plot
  exclude.intercept = TRUE
) +
  # further modification with the ggplot2 commands
  ggplot2::scale_y_discrete(
    labels = c(mpaa = "MPAA", genre = "Genre", `mpaa:genre` = "Interaction term")
  ) +
  ggplot2::labs(x = "effect size estimate (partial eta-squared)", y = NULL)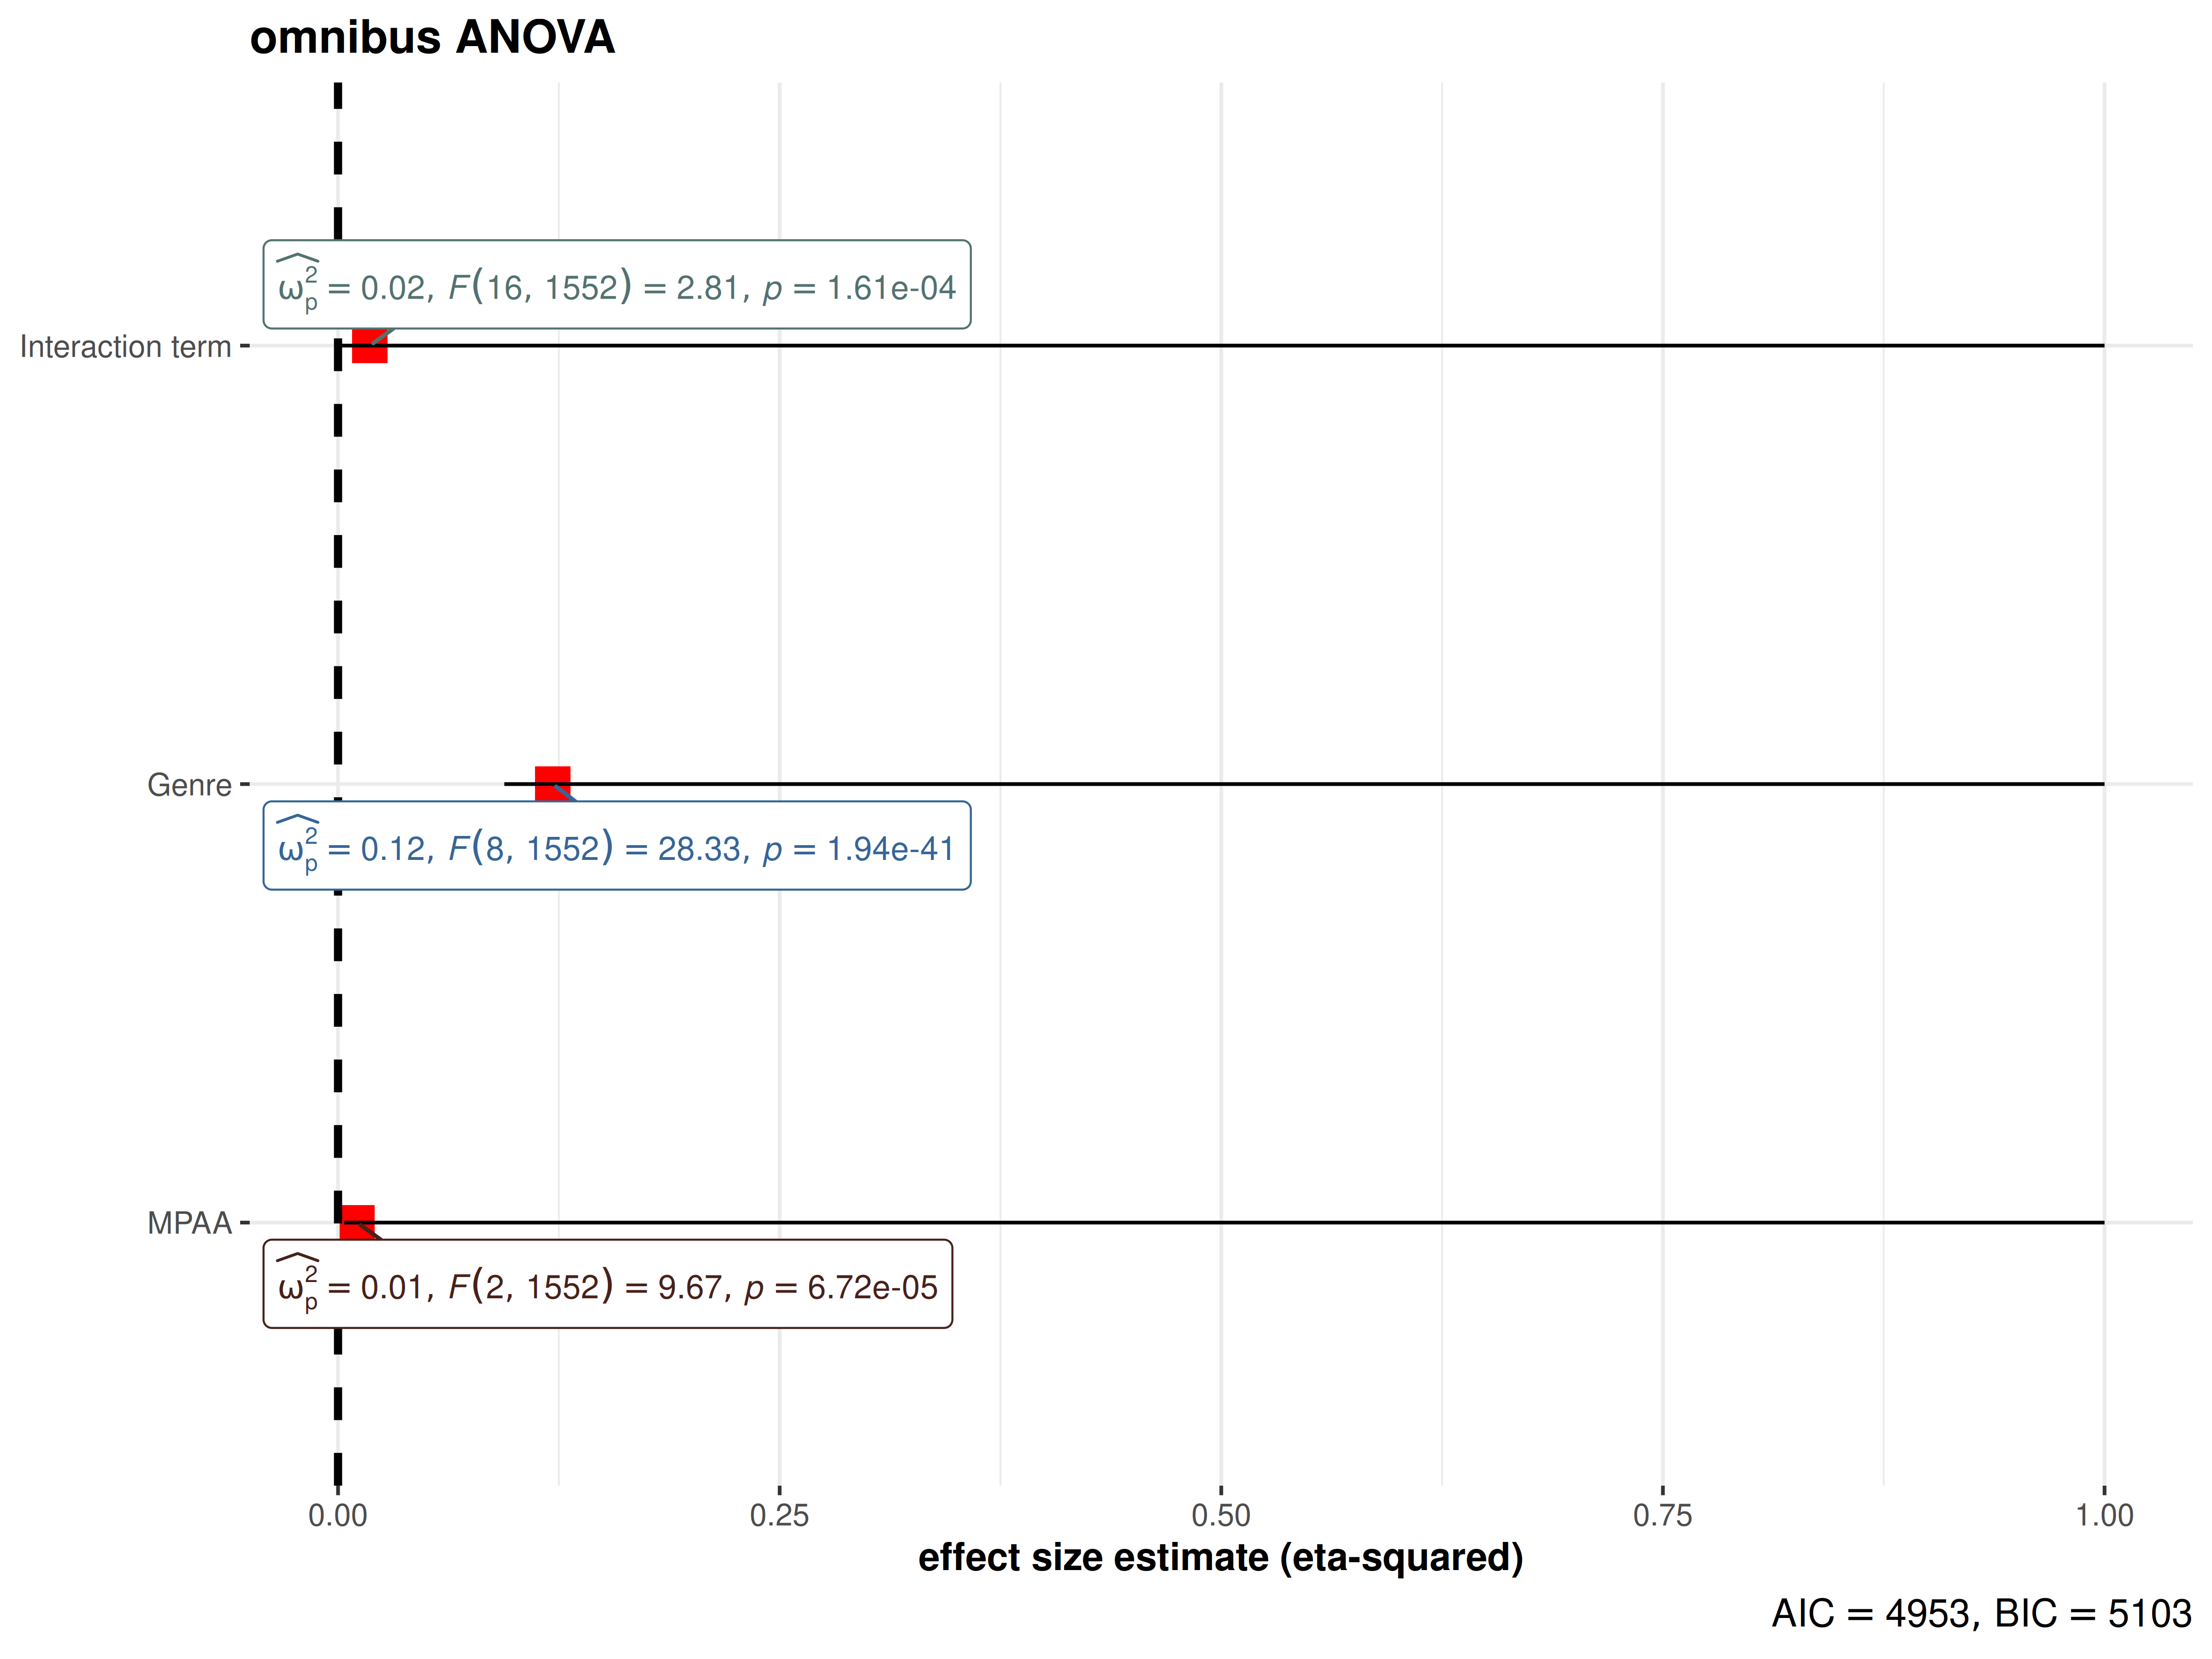
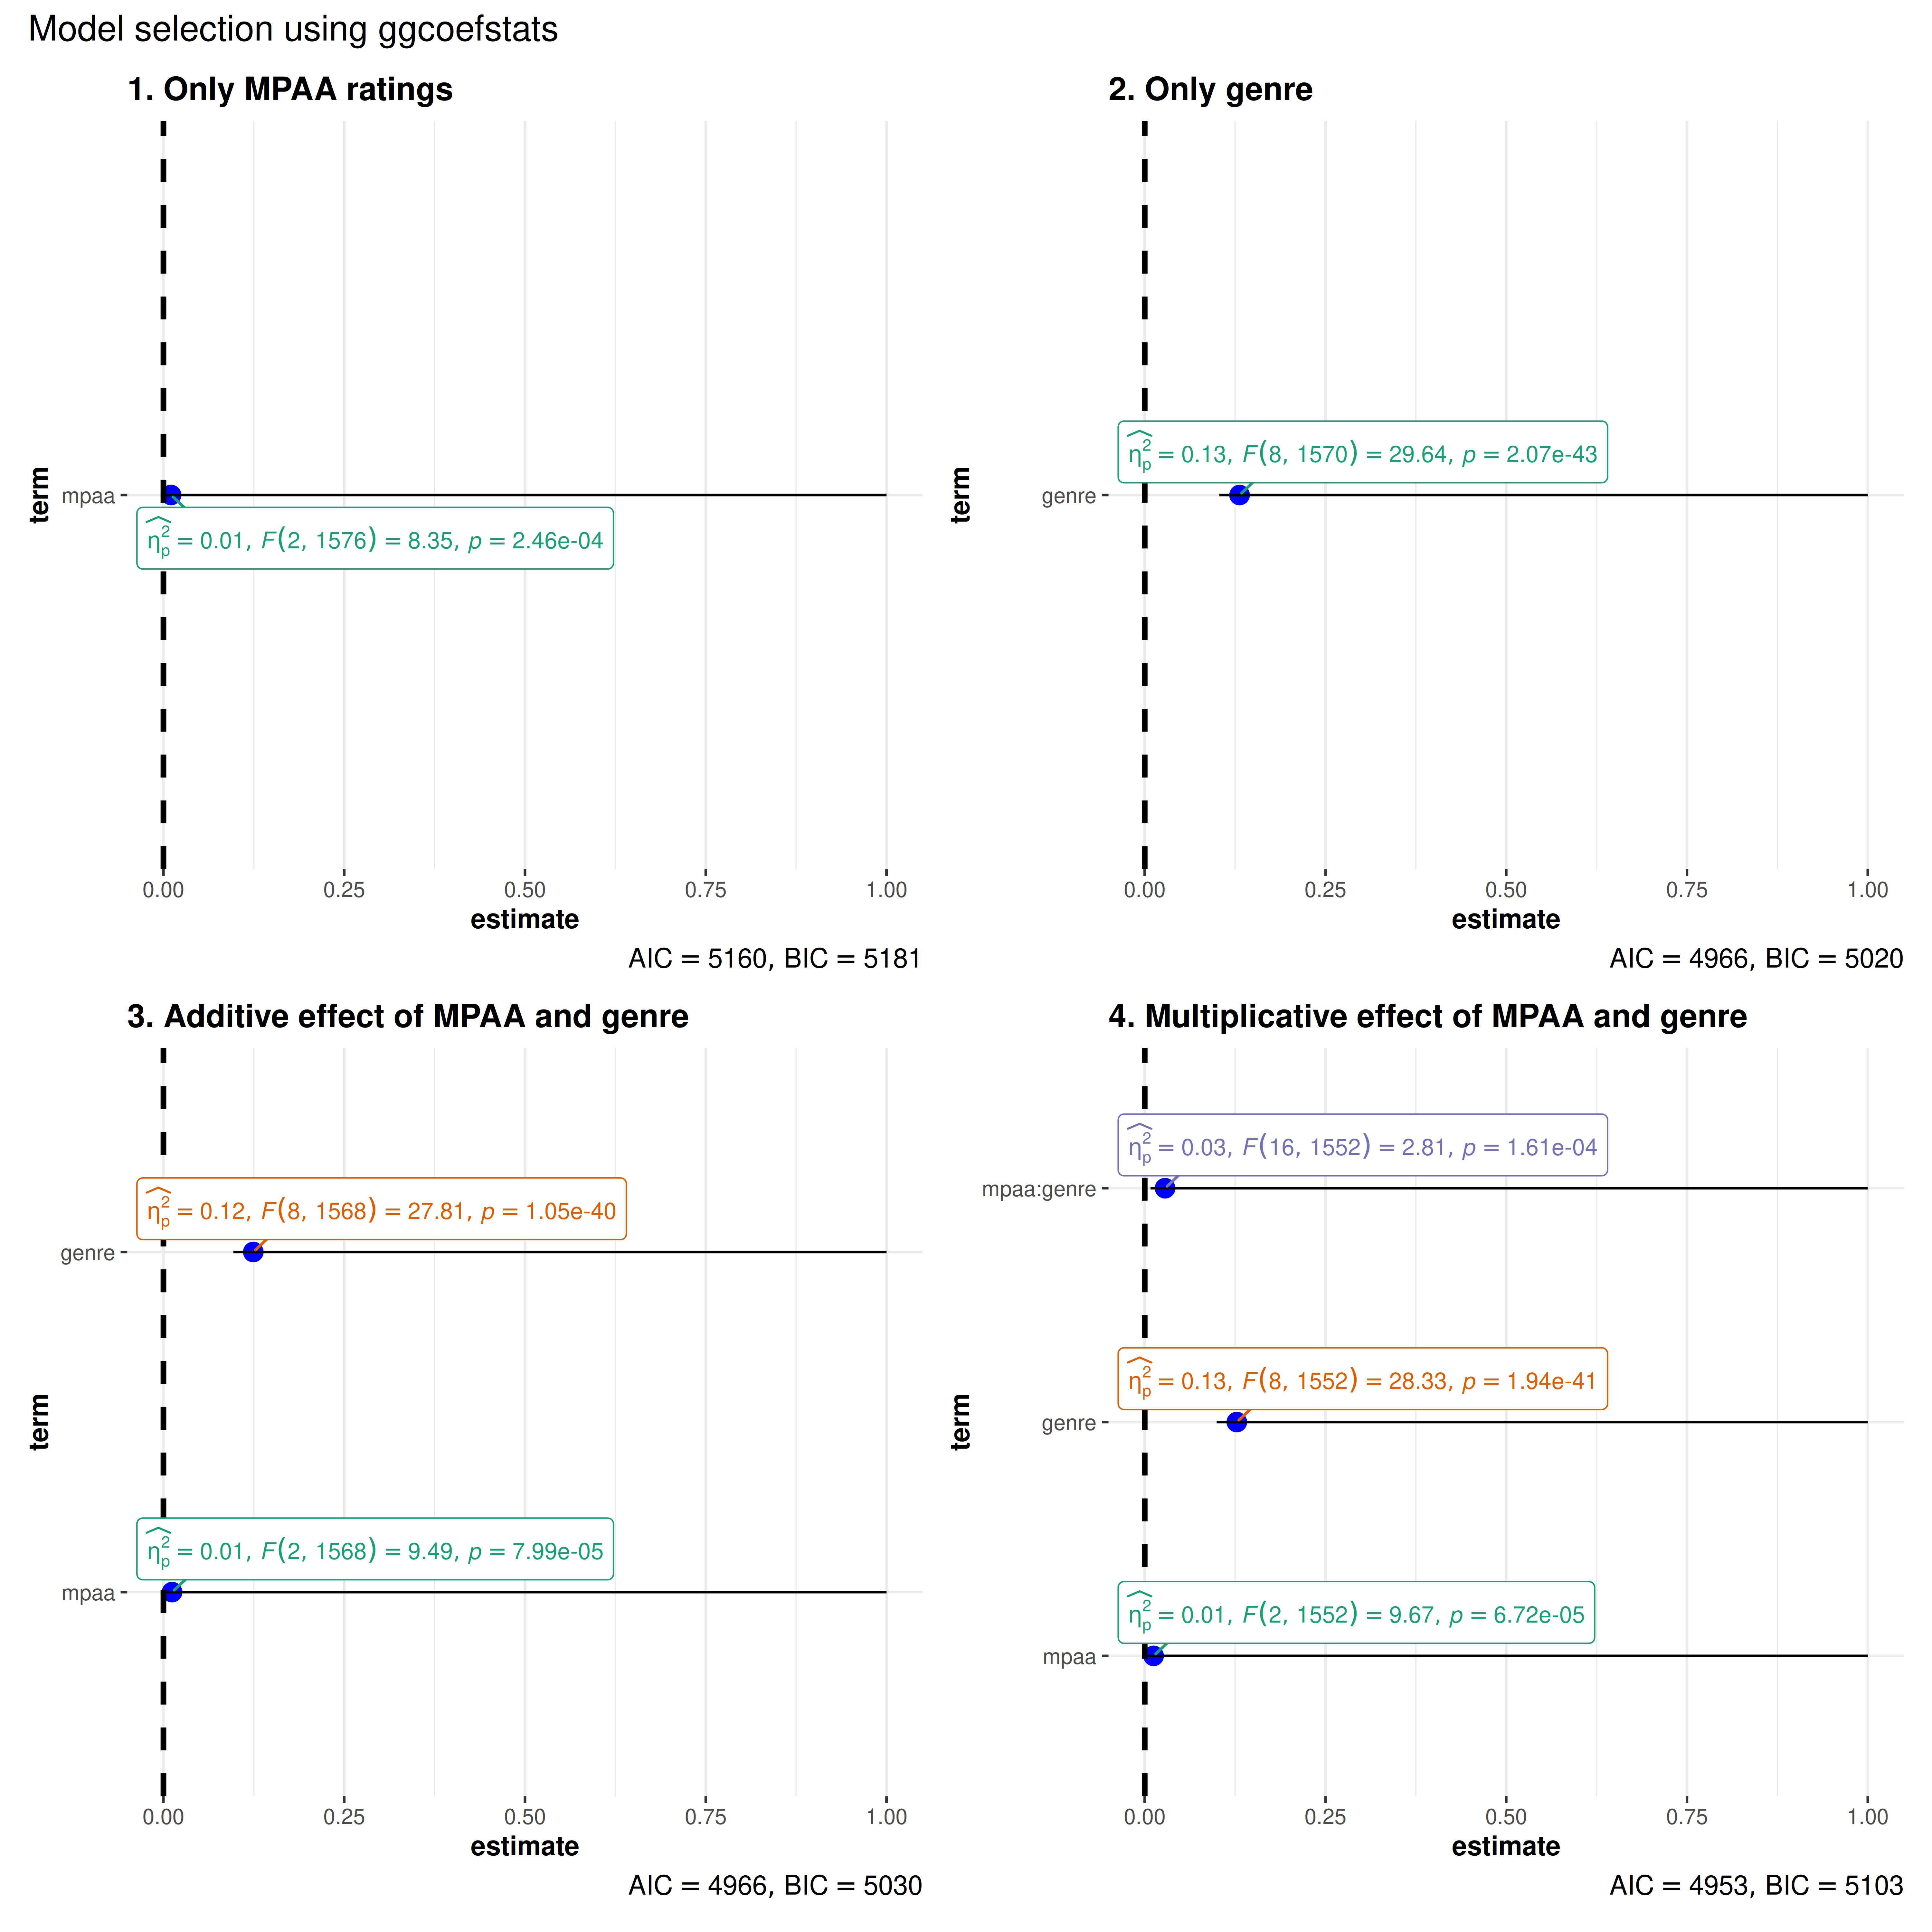
Note that we can also use this function for model selection. You can try out different models with the code below and see how the AIC and BIC values change.
combine_plots(
  plotlist = list(
    # model 1
    ggcoefstats(
      x = stats::aov(formula = rating ~ mpaa, data = movies_long),
      title = "1. Only MPAA ratings"
    ),
    # model 2
    ggcoefstats(
      x = stats::aov(formula = rating ~ genre, data = movies_long),
      title = "2. Only genre"
    ),
    # model 3
    ggcoefstats(
      x = stats::aov(formula = rating ~ mpaa + genre, data = movies_long),
      title = "3. Additive effect of MPAA and genre"
    ),
    # model 4
    ggcoefstats(
      x = stats::aov(formula = rating ~ mpaa * genre, data = movies_long),
      title = "4. Multiplicative effect of MPAA and genre"
    )
  ),
  annotation.args = list(title = "Model selection using ggcoefstats")
)
Bayesian models - no statistic
library(BayesFactor)

# one sample t-test
mod1 <- ttestBF(mtcars$wt, mu = 3)

# independent t-test
mod2 <- ttestBF(formula = wt ~ am, data = mtcars)

# paired t-test
mod3 <- ttestBF(x = sleep$extra[1:10], y = sleep$extra[11:20], paired = TRUE)

# correlation
mod4 <- correlationBF(y = iris$Sepal.Length, x = iris$Sepal.Width)

# contingency table (needs an effect size type to be specified)
data("raceDolls")
mod5 <- contingencyTableBF(
  raceDolls,
  sampleType = "indepMulti",
  fixedMargin = "cols"
)

# anova
data("puzzles")
mod6 <- anovaBF(
  formula = RT ~ shape * color + ID,
  data = puzzles,
  whichRandom = "ID",
  whichModels = "top",
  progress = FALSE
)

# regression-1
mod7 <- regressionBF(rating ~ ., data = attitude, progress = FALSE)

# meta-analysis
t <- c(-0.15, 2.39, 2.42, 2.43, -0.15, 2.39, 2.42, 2.43)
N <- c(100, 150, 97, 99, 99, 97, 100, 150)
mod8 <- meta.ttestBF(t, N, rscale = 1, nullInterval = c(0, Inf))

# proportion test
mod9 <- proportionBF(y = 15, N = 25, p = 0.5)

# list of plots
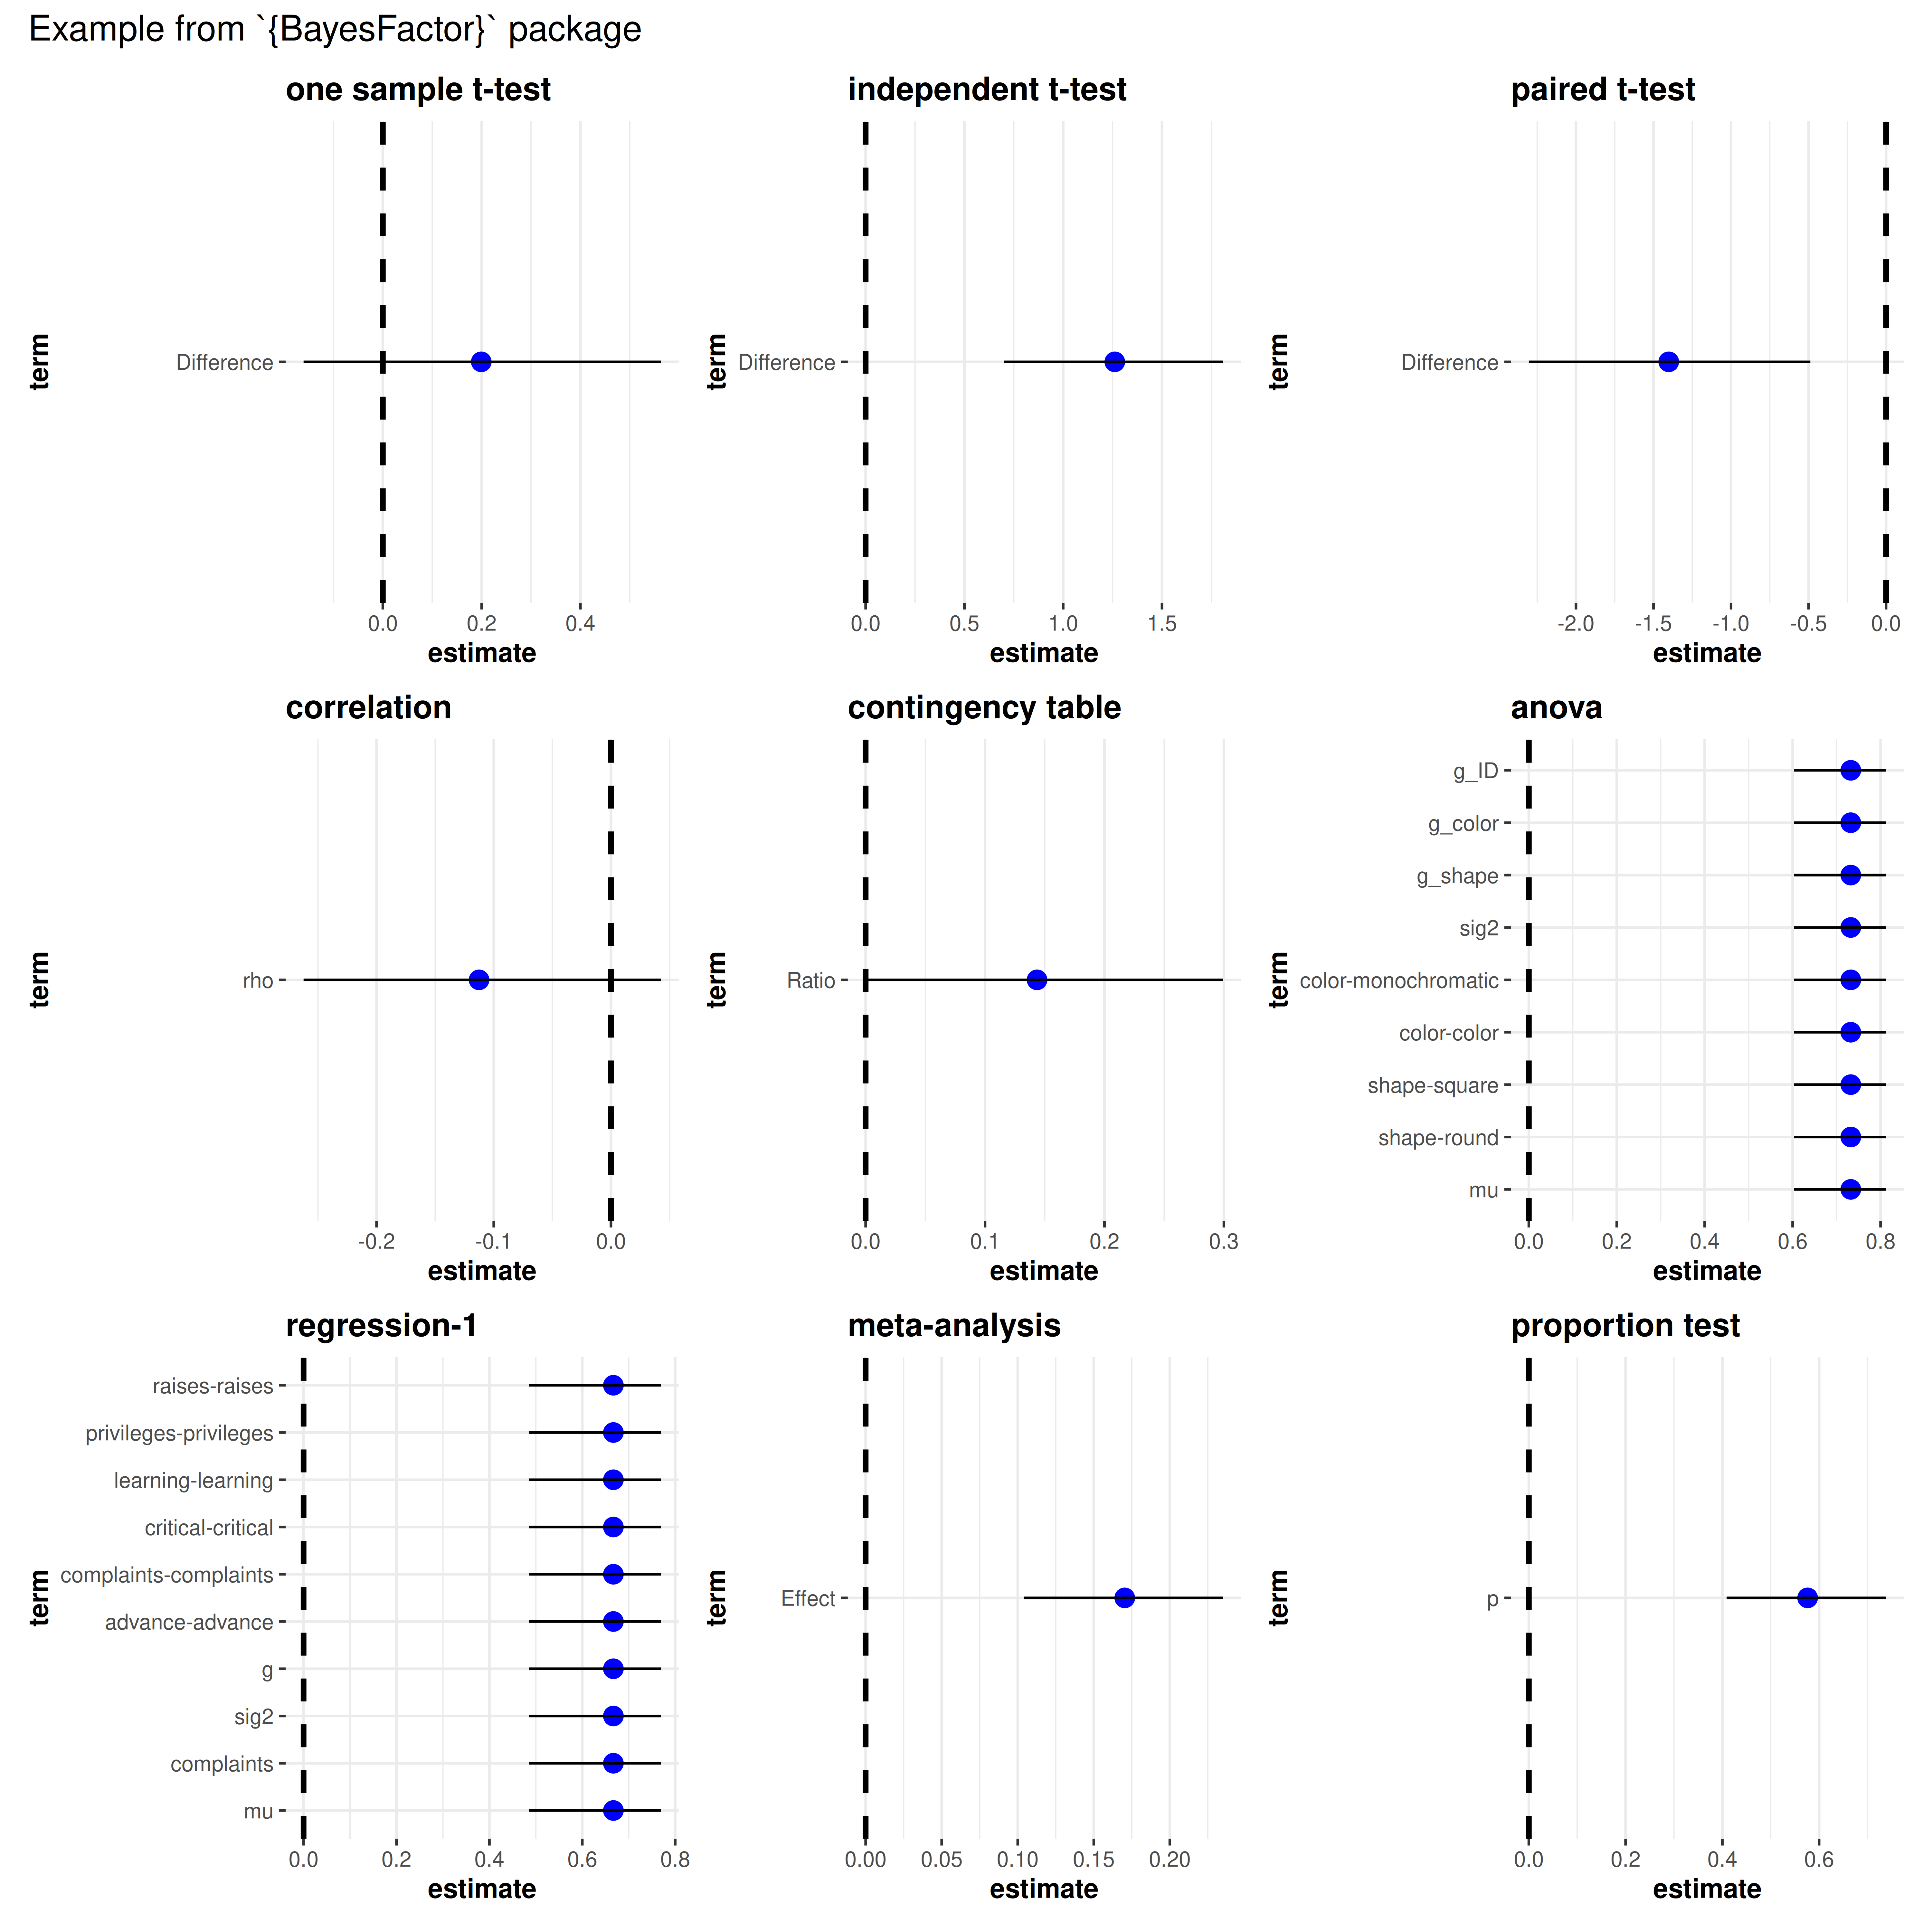
combine_plots(
  plotlist = list(
    ggcoefstats(mod1, title = "one sample t-test"),
    ggcoefstats(mod2, title = "independent t-test"),
    ggcoefstats(mod3, title = "paired t-test"),
    ggcoefstats(mod4, title = "correlation"),
    ggcoefstats(mod5, title = "contingency table", effectsize.type = "cramers_v"),
    ggcoefstats(mod6, title = "anova"),
    ggcoefstats(mod7, title = "regression-1"),
    ggcoefstats(mod8, title = "meta-analysis"),
    ggcoefstats(mod9, title = "proportion test")
  ),
  annotation.args = list(title = "Example from `{BayesFactor}` package")
)
Regression models with list outputs
Note that a number of regression models will return an object of
class list, in which case this function will fail. But
often you can extract the object of interest from this list and use it
to plot the regression coefficients.
library(gamm4)

# data
dat <- gamSim(1, n = 400, scale = 2)

# now add 20 level random effect `fac'...
dat$fac <- fac <- as.factor(sample(1:20, 400, replace = TRUE))
dat$y <- dat$y + model.matrix(~ fac - 1) %*% rnorm(20) * .5

# model object
br <- gamm4::gamm4(
  formula = y ~ s(x0) + x1 + s(x2),
  data = dat,
  random = ~ (1 | fac)
)

# looking at the classes of the objects contained in the list
purrr::map(br, class)

combine_plots(
  plotlist = list(
    # first object plot (only parametric terms are shown)
    ggcoefstats(
      x = br$gam,
      title = "generalized additive model (parametric terms)",
      digits = 3
    ),
    # second object plot
    ggcoefstats(
      x = br$mer,
      title = "linear mixed-effects model",
      digits = 3
    )
  ),
  plotgrid.args = list(nrow = 1)
)
Meta-analysis
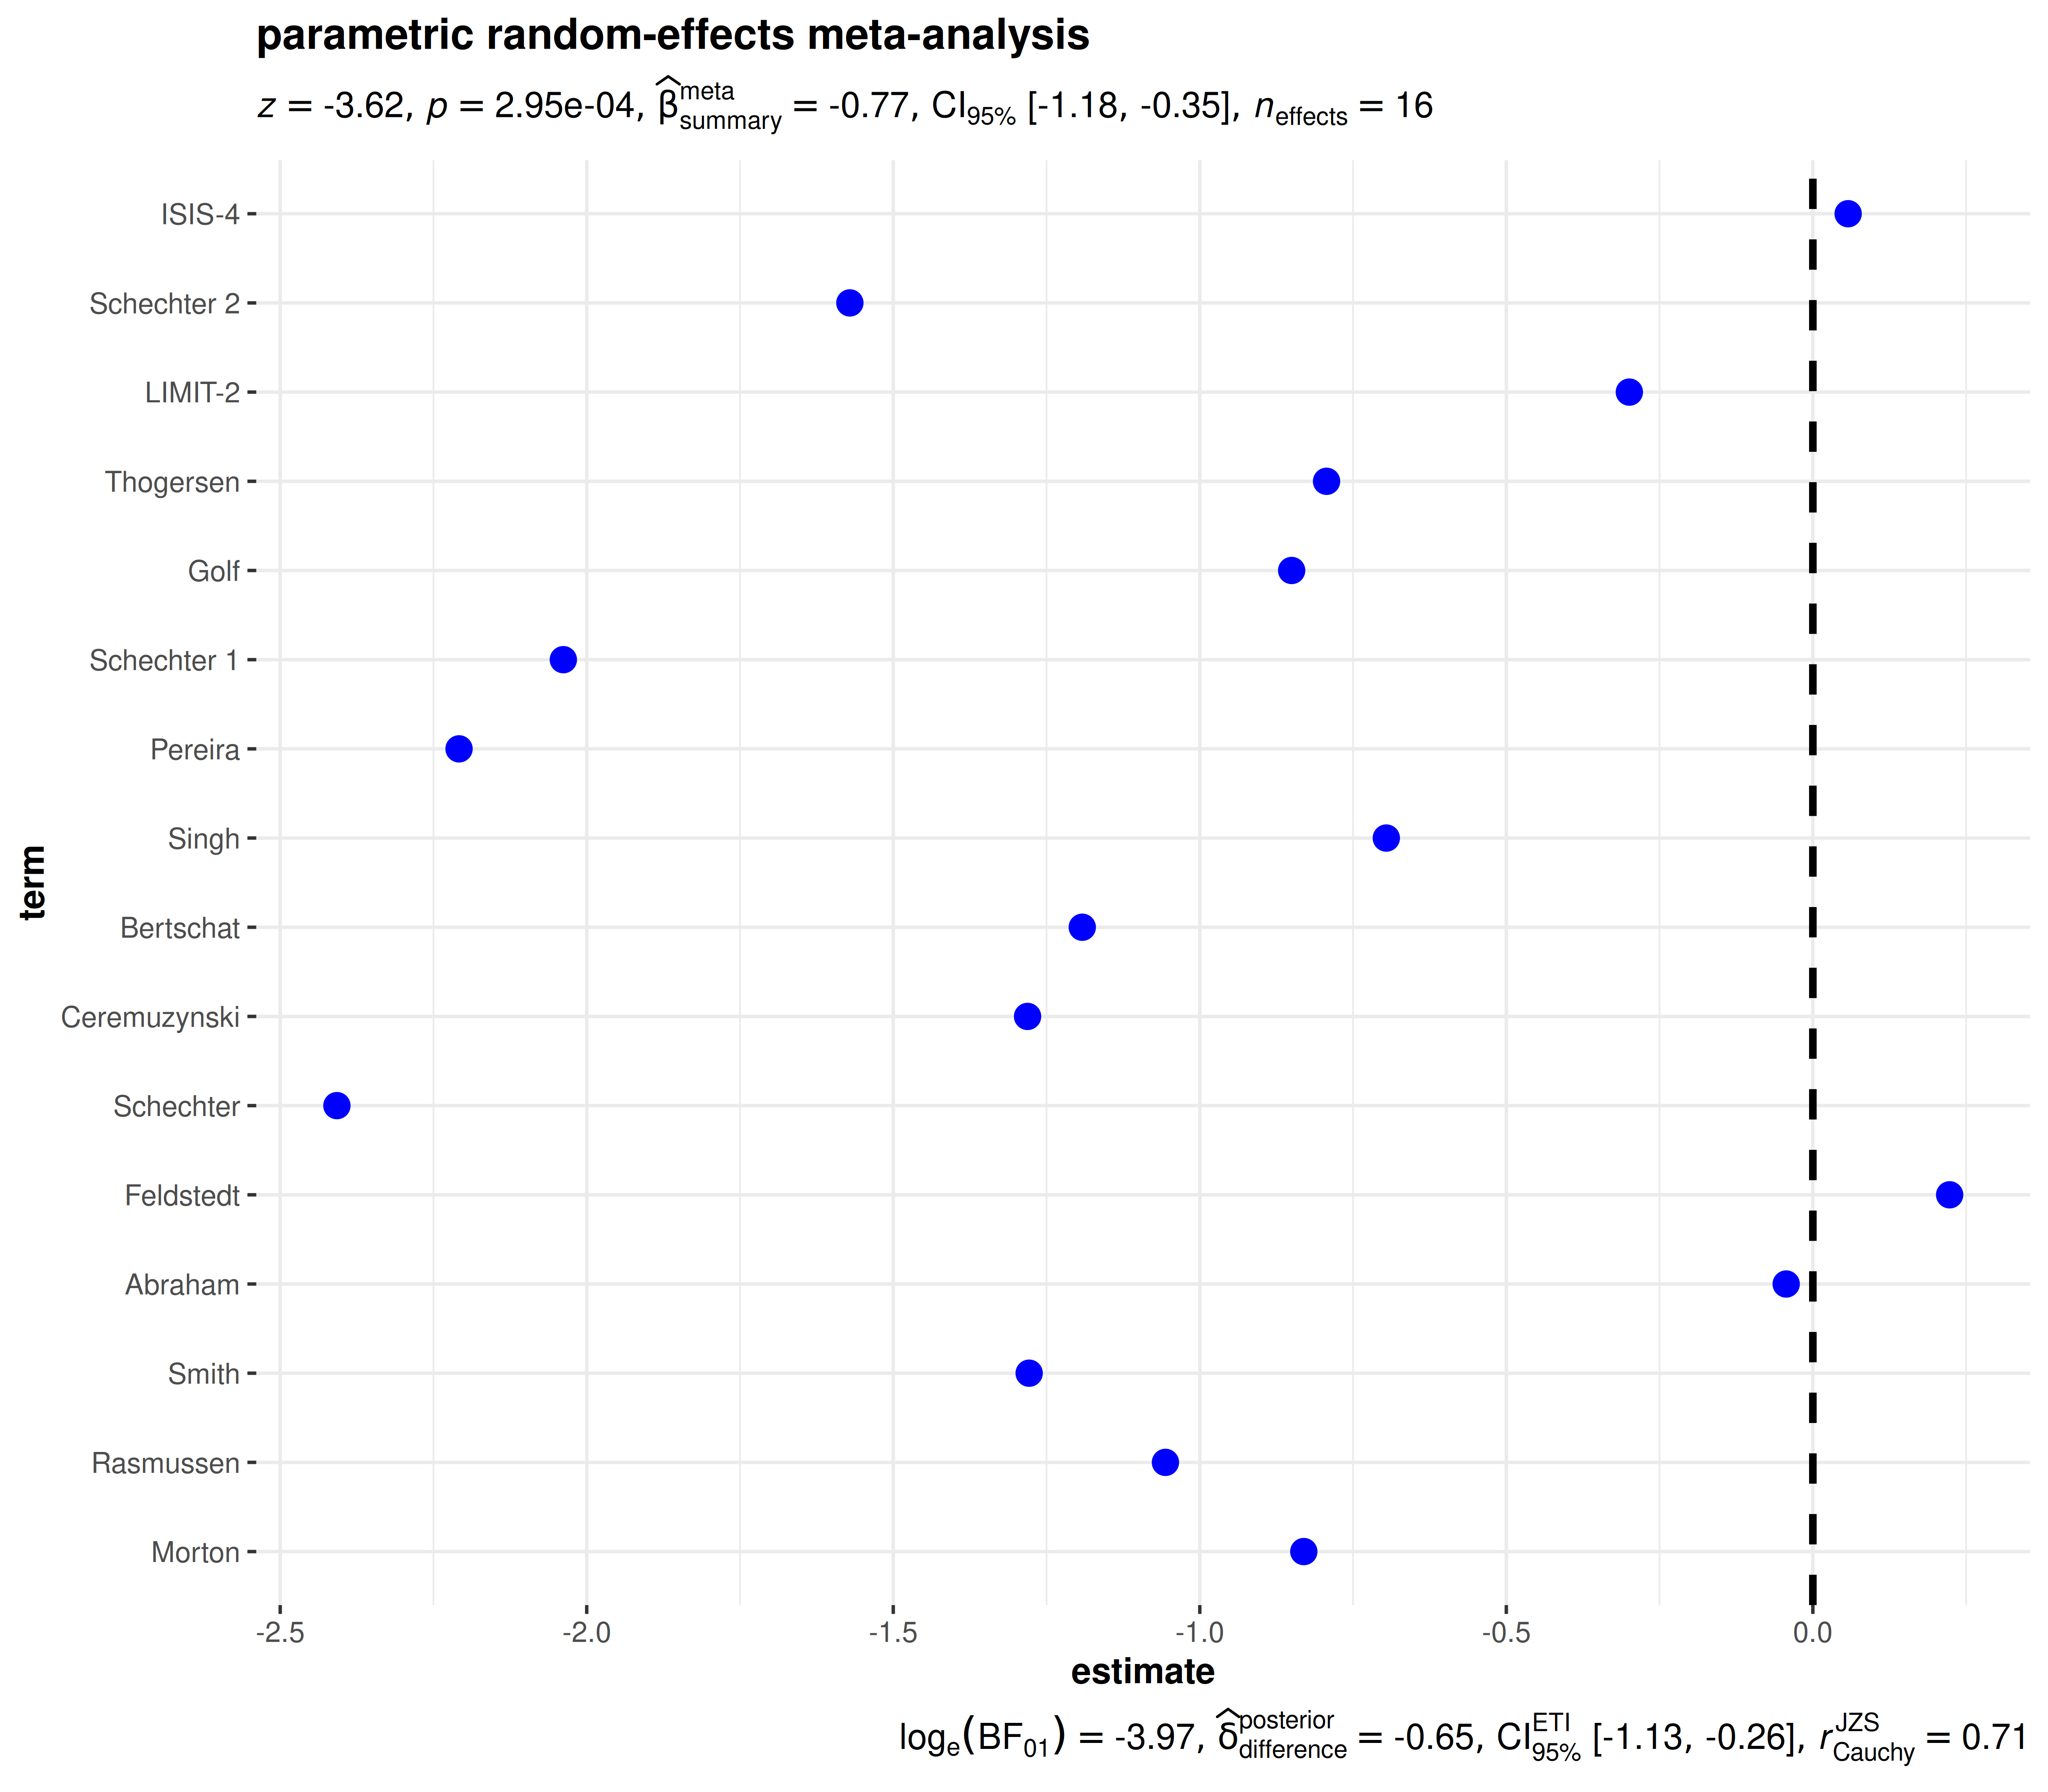
In case the estimates you are displaying come from multiple studies,
you can also use this function to carry out random-effects meta-analysis
by setting meta.analytic.effect = TRUE. The type of
meta-analysis is chosen with meta.type
("parametric", "robust", or
"bayes"). The data frame you enter must
contain the following two columns-
-
estimate: a column with the observed effect sizes or outcomes -
std.error: a column with the corresponding standard errors
An optional term column with names/identifiers annotates
each study/effect.
parametric
library(metaplus)

# renaming to what the function expects
df <- dplyr::rename(mag, estimate = yi, std.error = sei, term = study)

ggcoefstats(
  x = df,
  meta.analytic.effect = TRUE,
  meta.type = "parametric",
  title = "parametric random-effects meta-analysis"
)
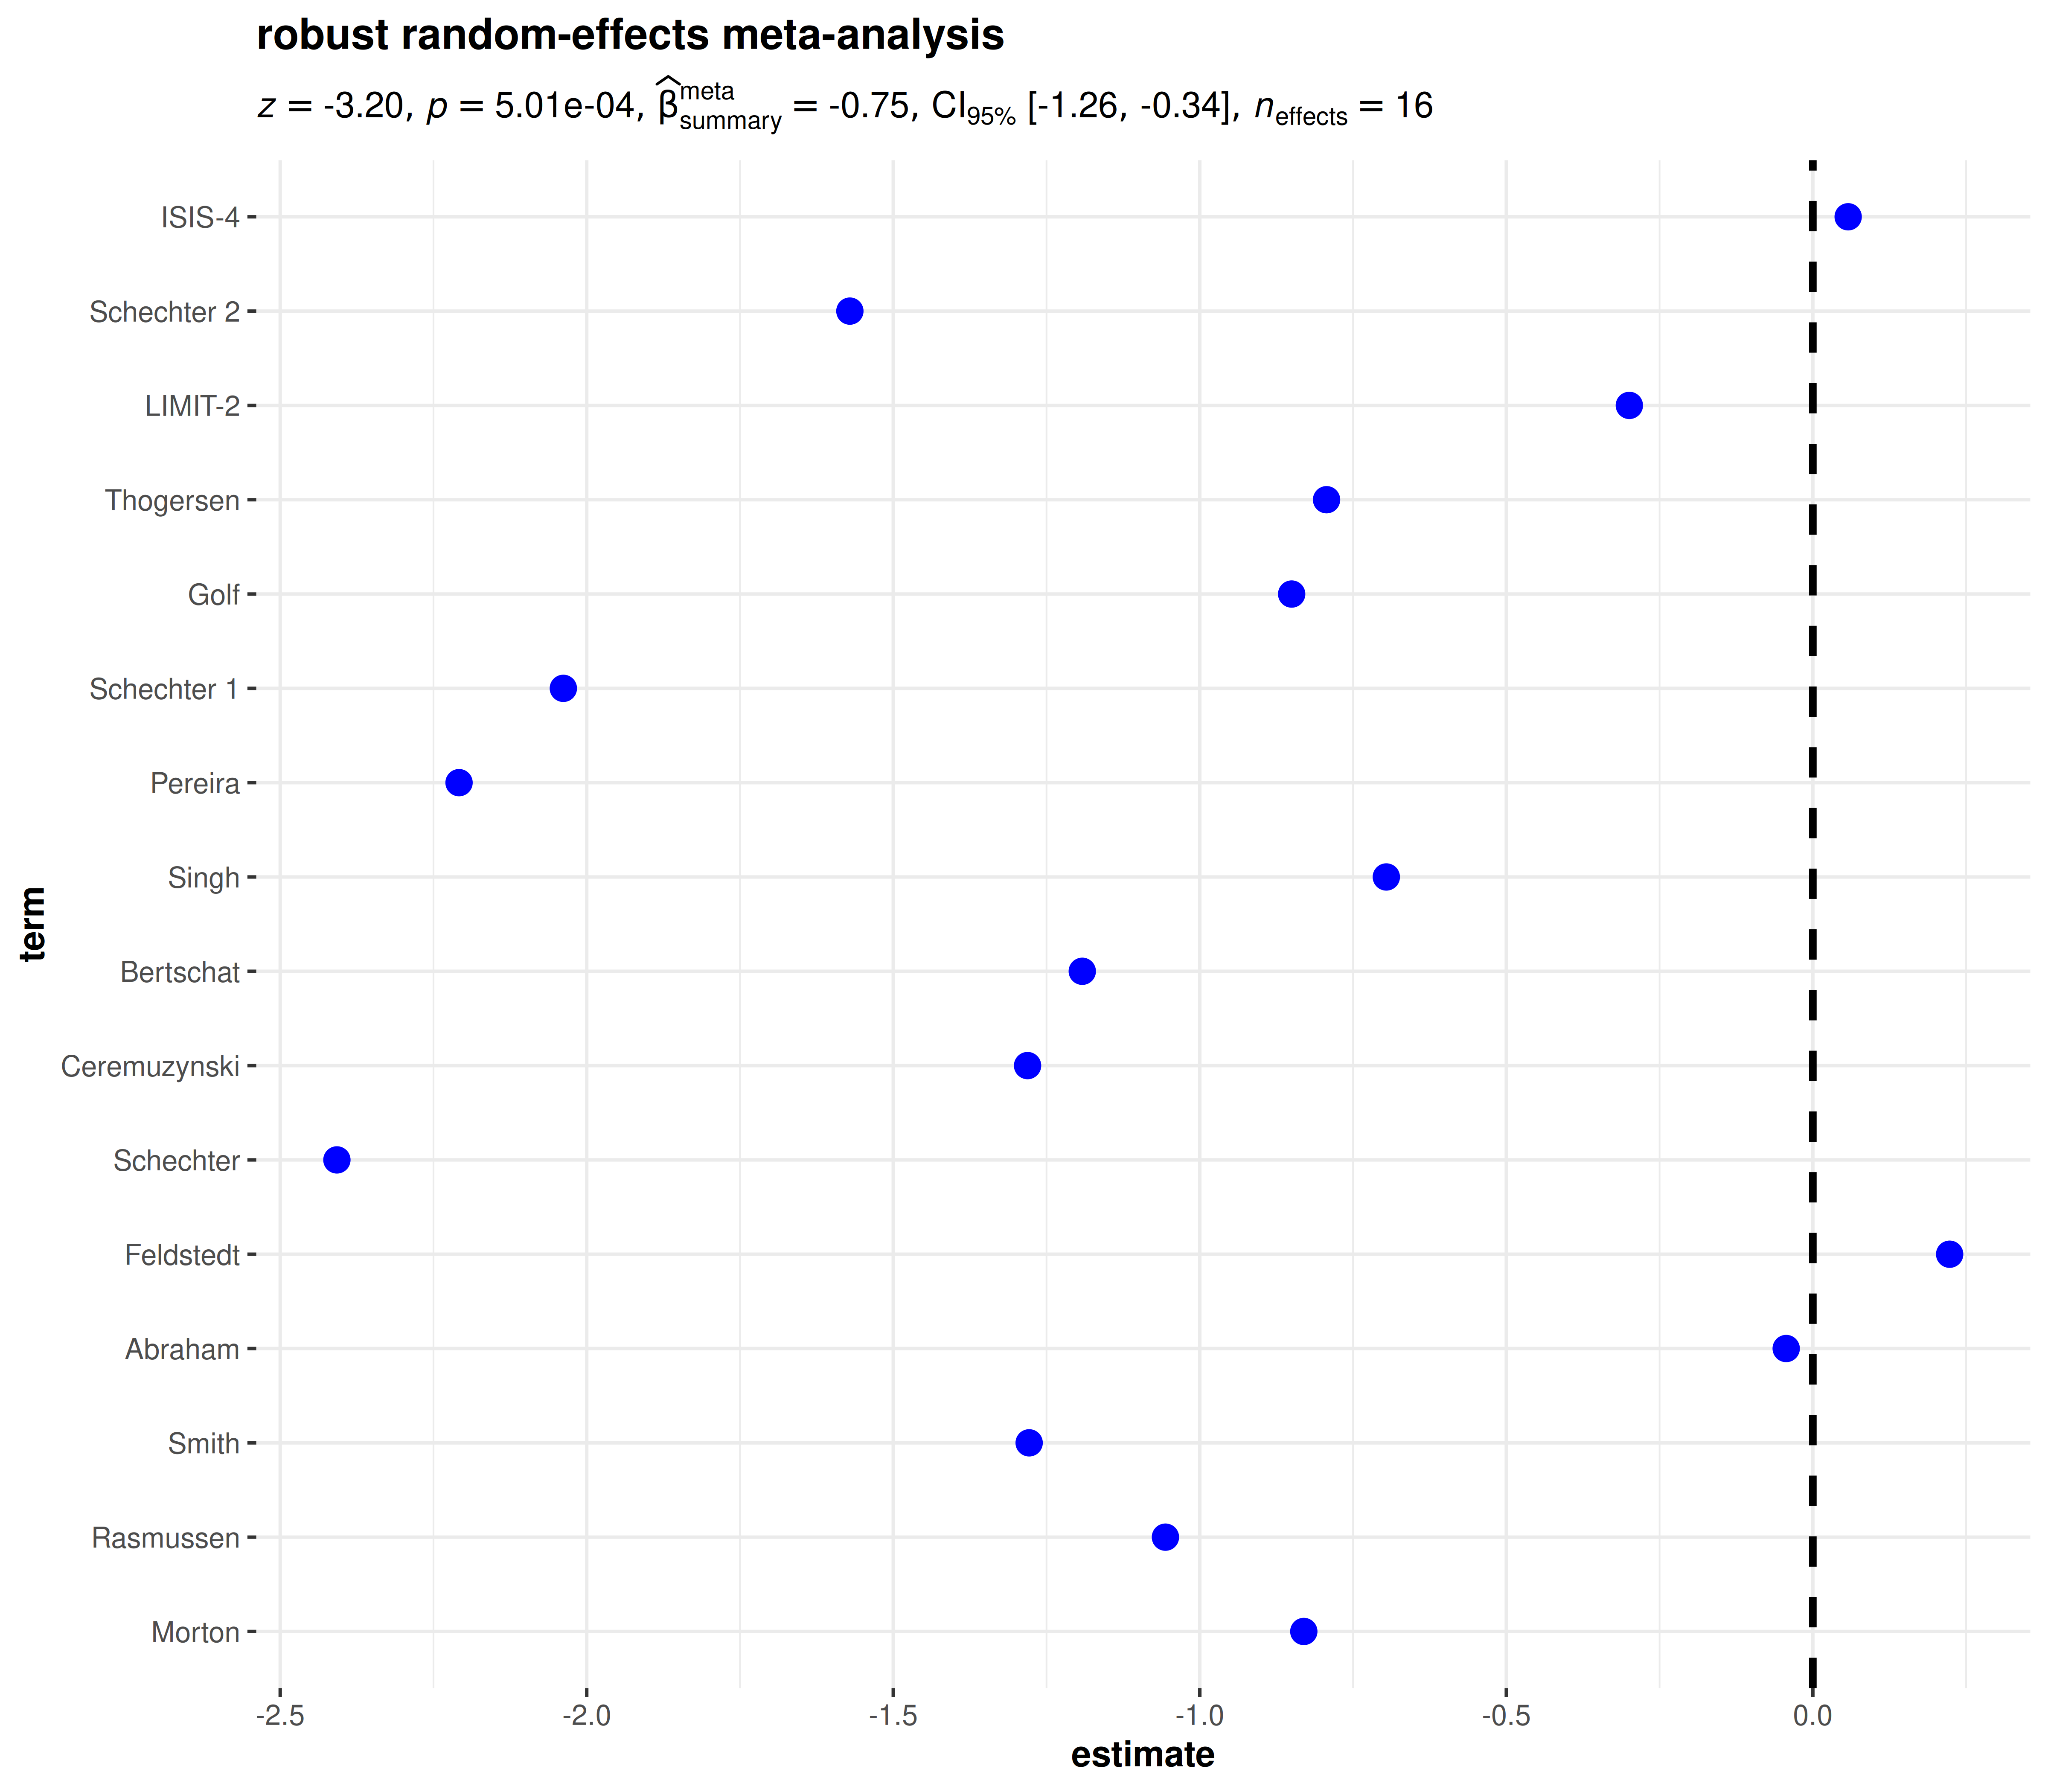
robust
ggcoefstats(
  x = df,
  meta.analytic.effect = TRUE,
  meta.type = "robust",
  title = "robust random-effects meta-analysis"
)
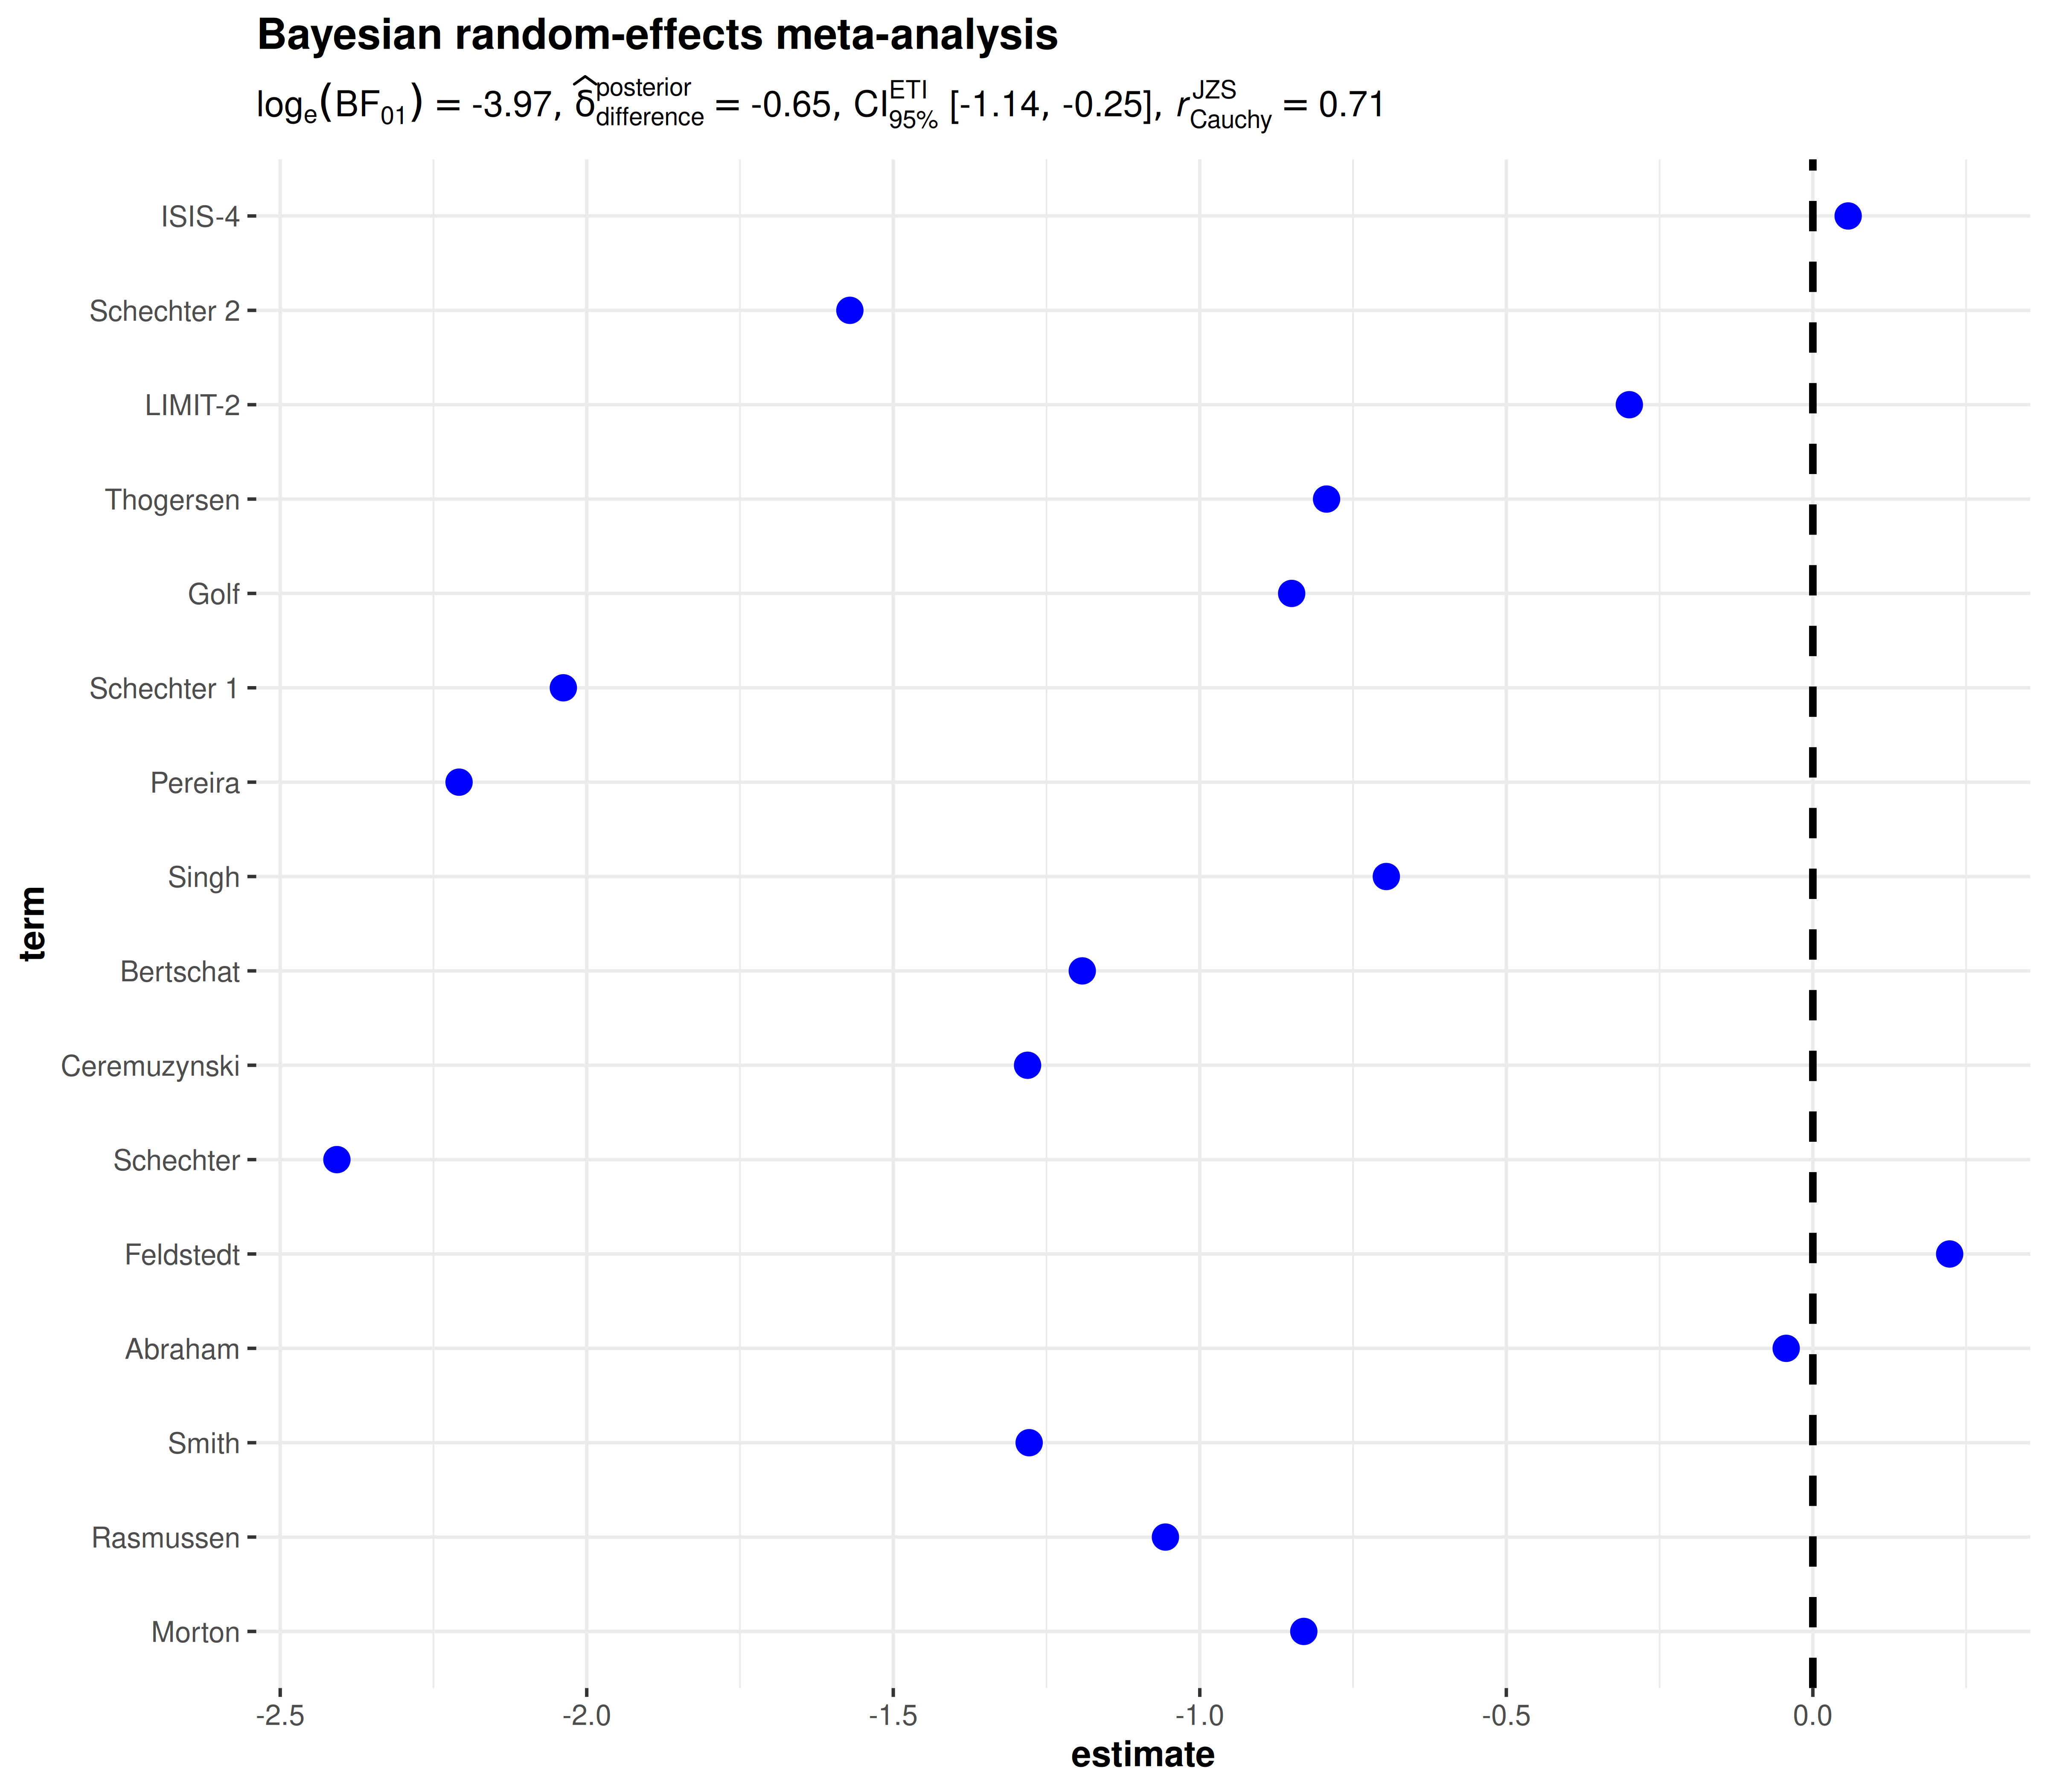
Bayesian
# suppress Stan's divergent transitions warning (not under our control)
suppressWarnings(
  ggcoefstats(
    x = df,
    meta.analytic.effect = TRUE,
    meta.type = "bayes",
    title = "Bayesian random-effects meta-analysis"
  )
)
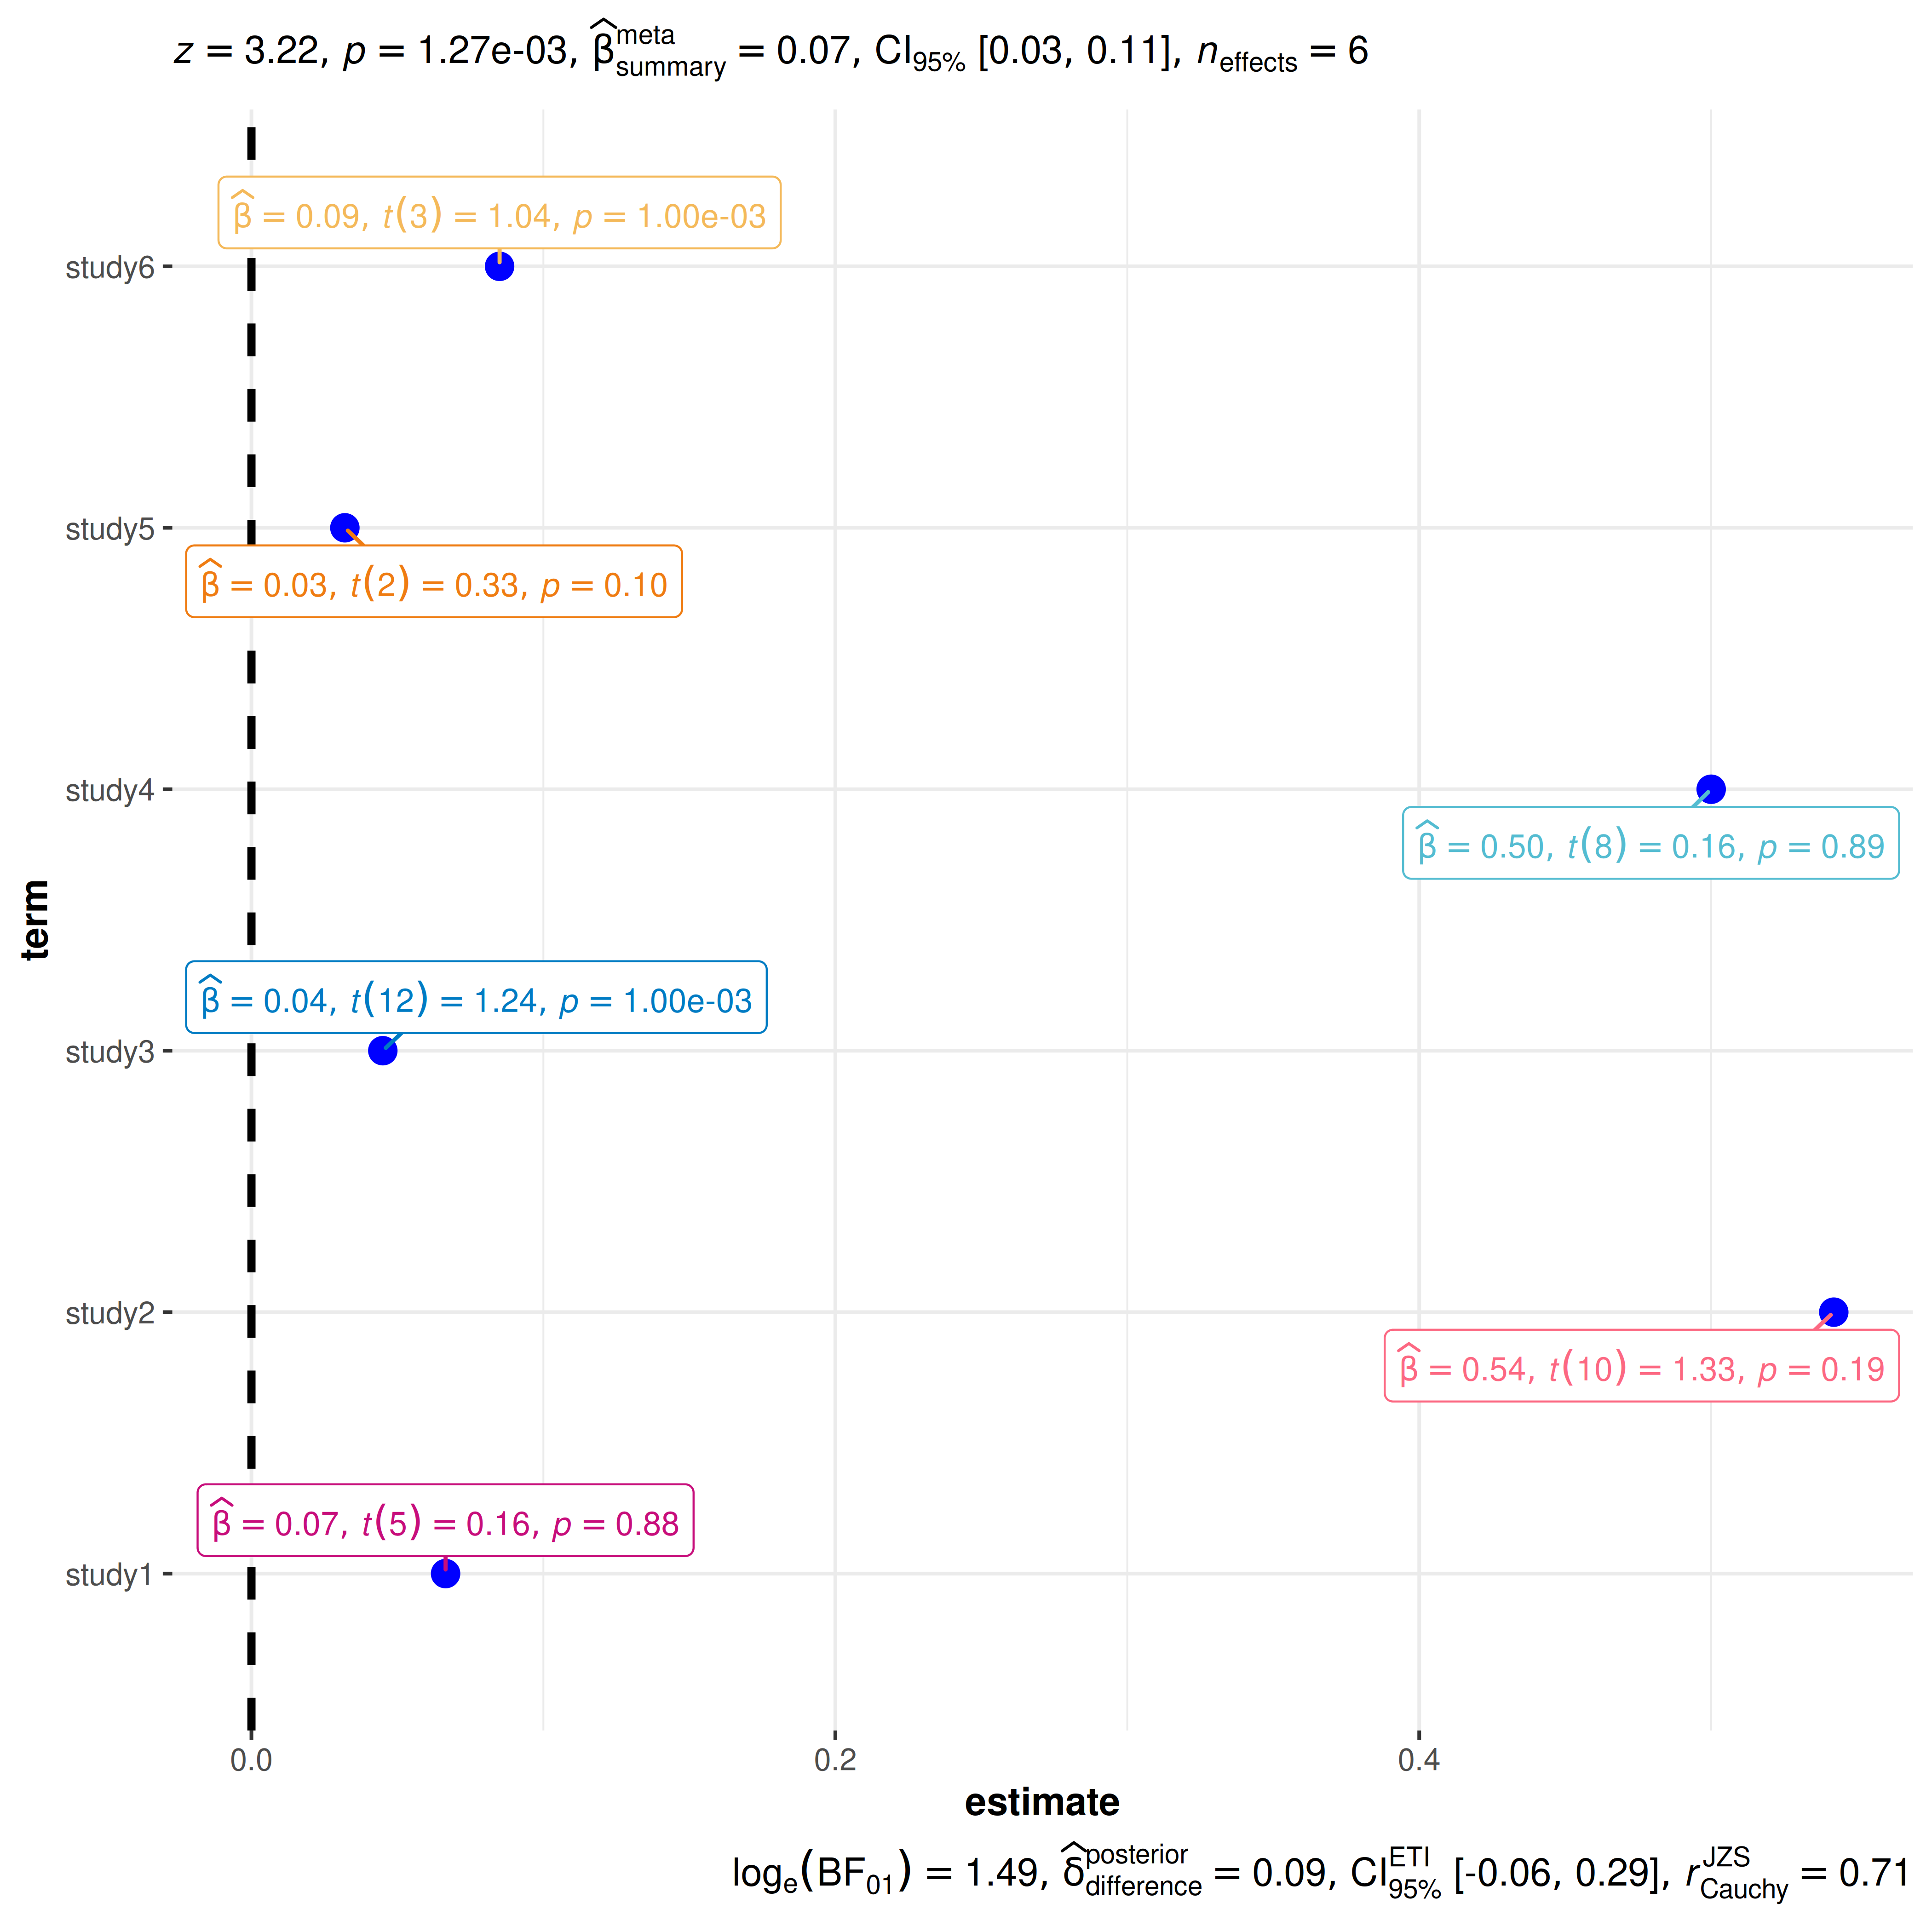
Data frames
Sometimes you don’t have a model object but a custom data frame that
you want to display using this function. If a data frame is to be
plotted, it must contain an estimate
column. The optional term column names the predictors;
otherwise, names such as term_1 are generated. See the x
argument in the function reference for the columns needed for
confidence intervals, labels, and meta-analysis. Specify
statistic ("t", "z",
"f", or "chi") to display statistical labels
for a data frame.
# let's create a data frame
df_full <- tibble::tribble(
  ~term, ~statistic, ~estimate, ~std.error, ~p.value, ~df.error,
  "study1", 0.158, 0.0665, 0.778, 0.875, 5L,
  "study2", 1.33, 0.542, 0.280, 0.191, 10L,
  "study3", 1.24, 0.045, 0.030, 0.001, 12L,
  "study4", 0.156, 0.500, 0.708, 0.885, 8L,
  "study5", 0.33, 0.032, 0.280, 0.101, 2L,
  "study6", 1.04, 0.085, 0.030, 0.001, 3L
)

ggcoefstats(
  x = df_full,
  meta.analytic.effect = TRUE,
  statistic = "t",
  palette = "LaCroixColoR::paired"
)
Non-plot outputs
The data frames underlying the plot can be extracted with
extract_stats(): tidy_data contains the
estimates and statistical details for each term, while
glance_data contains the model performance indices (e.g.,
AIC and BIC). That said, if you only need these data frames, it is
preferable to use the underlying functions
(parameters::model_parameters() and
performance::model_performance()) directly.
# data
DNase1 <- subset(DNase, Run == 1)

# using a selfStart model
nlmod <- stats::nls(density ~ SSlogis(log(conc), Asym, xmid, scal), DNase1)

# data frames
ggcoefstats(nlmod) |> extract_stats()
#> $subtitle_data
#> NULL
#>
#> $caption_data
#> NULL
#>
#> $pairwise_comparisons_data
#> NULL
#>
#> $descriptive_data
#> NULL
#>
#> $one_sample_data
#> NULL
#>
#> $tidy_data
#> # A tibble: 3 × 11
#>   term  estimate std.error conf.level conf.low conf.high statistic df.error
#>   <fct>    <dbl>     <dbl>      <dbl>    <dbl>     <dbl>     <dbl>    <int>
#> 1 Asym      2.35    0.0782       0.95    2.18       2.51      30.0       13
#> 2 xmid      1.48    0.0814       0.95    1.31       1.66      18.2       13
#> 3 scal      1.04    0.0323       0.95    0.972      1.11      32.3       13
#>    p.value conf.method expression
#>      <dbl> <chr>       <list>
#> 1 2.17e-13 Wald        <language>
#> 2 1.22e-10 Wald        <language>
#> 3 8.51e-14 Wald        <language>
#>
#> $glance_data
#> # A tibble: 0 × 0
#>
#> attr(,"class")
#> [1] "ggstatsplot_stats" "list"
Summary of graphics and tests
| graphical element |
geom used |
argument for further modification |
|---|---|---|
| regression estimate | ggplot2::geom_point() |
point.args |
| error bars | ggplot2::geom_errorbar() |
errorbar.args |
| vertical line | ggplot2::geom_vline() |
vline.args |
| label with statistical details | ggrepel::geom_label_repel() |
stats.label.args |
More details about the statistical details displayed for different models can be found in the function documentation: https://www.indrapatil.com/ggstatsplot/reference/ggcoefstats.html
Not supported
The list of supported models will keep expanding as additional
tidiers are added to the parameters and
performance packages. Note that not all
models supported in these packages will be supported by
ggcoefstats(). In particular, classes of objects for which
there is no column for estimate (e.g., kmeans,
optim, muhaz, survdiff,
zoo, etc.) are not supported.
Suggestions
If you find any bugs or have any suggestions/remarks, please file an issue on GitHub: https://github.com/IndrajeetPatil/ggstatsplot/issues
Citation
You can cite this package/vignette as:
To cite package 'ggstatsplot' in publications use:

  Patil, I. (2021). Visualizations with statistical details: The
  'ggstatsplot' approach. Journal of Open Source Software, 6(61), 3167,
  doi:10.21105/joss.03167

A BibTeX entry for LaTeX users is

  @Article{,
    doi = {10.21105/joss.03167},
    url = {https://doi.org/10.21105/joss.03167},
    year = {2021},
    publisher = {{The Open Journal}},
    volume = {6},
    number = {61},
    pages = {3167},
    author = {Indrajeet Patil},
    title = {{Visualizations with statistical details: The {'ggstatsplot'} approach}},
    journal = {{Journal of Open Source Software}},
  }