Lifecycle: 
The function ggscatterstats is meant to provide a
publication-ready scatterplot with all statistical
details included in the plot itself to show association between two
continuous variables. This function is also helpful during the
data exploration phase. We will see examples of how to
use this function in this vignette with the ggplot2movies
dataset.
To begin with, here are some instances where you would want to use
ggscatterstats-
- to check linear association between two continuous variables
- to check distribution of two continuous variables
Correlation plot with ggscatterstats
To illustrate how this function can be used, we will rely on the
ggplot2movies dataset. This dataset provides information
about movies scraped from IMDB.
Specifically, we will be using a cleaned version of this dataset
included in the ggstatsplot package itself.
## see the selected data
dplyr::glimpse(movies_long)
#> Rows: 1,579
#> Columns: 8
#> $ title  <chr> "Shawshank Redemption, The", "Lord of the Rings: The Return of …
#> $ year   <int> 1994, 2003, 2001, 2002, 1994, 1993, 1977, 1980, 1968, 2002, 196…
#> $ length <int> 142, 251, 208, 223, 168, 195, 125, 129, 158, 135, 93, 113, 108,…
#> $ budget <dbl> 25.0, 94.0, 93.0, 94.0, 8.0, 25.0, 11.0, 18.0, 5.0, 3.3, 1.8, 5…
#> $ rating <dbl> 9.1, 9.0, 8.8, 8.8, 8.8, 8.8, 8.8, 8.8, 8.7, 8.7, 8.7, 8.7, 8.6…
#> $ votes  <int> 149494, 103631, 157608, 114797, 132745, 97667, 134640, 103706, …
#> $ mpaa   <fct> R, PG-13, PG-13, PG-13, R, R, PG, PG, PG-13, R, PG, R, R, R, R,…
#> $ genre  <fct> Drama, Action, Action, Action, Drama, Drama, Action, Action, Dr…
Now that we have a clean dataset, we can start asking some interesting questions. For example, let’s see if the average IMDB rating for a movie has any relationship to its budget. Additionally, let’s also see which movies had a high budget but low IMDB rating by labeling those data points.
Note that the marginal histograms are drawn with the
ggside package; set marginal = FALSE to turn
them off.
ggscatterstats(
  data = movies_long, ## data frame from which variables are taken
  x = budget, ## predictor/independent variable
  y = rating, ## dependent variable
  xlab = "Budget (in millions of US dollars)", ## label for the x-axis
  ylab = "Rating on IMDB", ## label for the y-axis
  label.var = title, ## variable to use for labeling data points
  label.expression = rating < 5 & budget > 100, ## expression for deciding which points to label
  point.label.args = list(alpha = 0.7, size = 4, color = "grey50"),
  xsidehistogram.args = list(fill = "#CC79A7"), ## fill for marginals on the x-axis
  ysidehistogram.args = list(fill = "#009E73"), ## fill for marginals on the y-axis
  title = "Relationship between movie budget and IMDB rating",
  caption = "Source: www.imdb.com"
)
There is indeed a small, but significant, positive correlation between the amount of money a studio invests in a movie and the ratings given by the audiences.
Grouped analysis with grouped_ggscatterstats
What if we want to do the same analysis for movies with different MPAA (Motion Picture Association of America) film ratings (PG, PG-13, R)?
ggstatsplot provides a special helper function for
such instances: grouped_ggscatterstats. This is merely a
wrapper function around combine_plots. It applies
ggscatterstats across all levels of a
specified grouping variable and then combines list of
individual plots into a single plot. Note that the grouping variable can
be anything: conditions in a given study, groups in a study sample,
different studies, etc.
Let’s see how we can use this function to apply
ggscatterstats for all MPAA ratings. Also, let’s run a
robust test this time.
grouped_ggscatterstats(
  ## arguments relevant for ggscatterstats
  data = movies_long,
  x = budget,
  y = rating,
  grouping.var = mpaa,
  label.var = title,
  label.expression = rating < 5 & budget > 80,
  type = "r",
  ## arguments relevant for combine_plots
  annotation.args = list(
    title = "Relationship between movie budget and IMDB rating",
    caption = "Source: www.imdb.com"
  ),
  plotgrid.args = list(nrow = 3, ncol = 1)
)
As seen from the plot, this analysis has revealed something interesting: The relationship we found between budget and IMDB rating holds only for PG-13 and R-rated movies.
Grouped analysis with ggscatterstats +
{purrr}
For group-specific arguments or multiple grouping variables, see the programmatic plotting article. It explains how to split the data, customize each call, and combine the resulting plots.
Summary of graphics and tests
| graphical element |
geom used |
argument for further modification |
|---|---|---|
| raw data | ggplot2::geom_point() |
point.args |
| labels for raw data | ggrepel::geom_label_repel() |
point.label.args |
| smooth line | ggplot2::geom_smooth() |
smooth.line.args |
| marginal histograms |
ggside::geom_xsidehistogram(),
ggside::geom_ysidehistogram()
|
xsidehistogram.args,
ysidehistogram.args
|
The statistical tests and effect sizes carried out for each
type are listed in the function documentation: https://www.indrapatil.com/ggstatsplot/reference/ggscatterstats.html
Extracting statistical details
Use extract_stats()
to retrieve the results as data frames; its reference page describes all
returned components, including the lists returned for
grouped_ plots.
p <- ggscatterstats(mtcars, qsec, drat)
p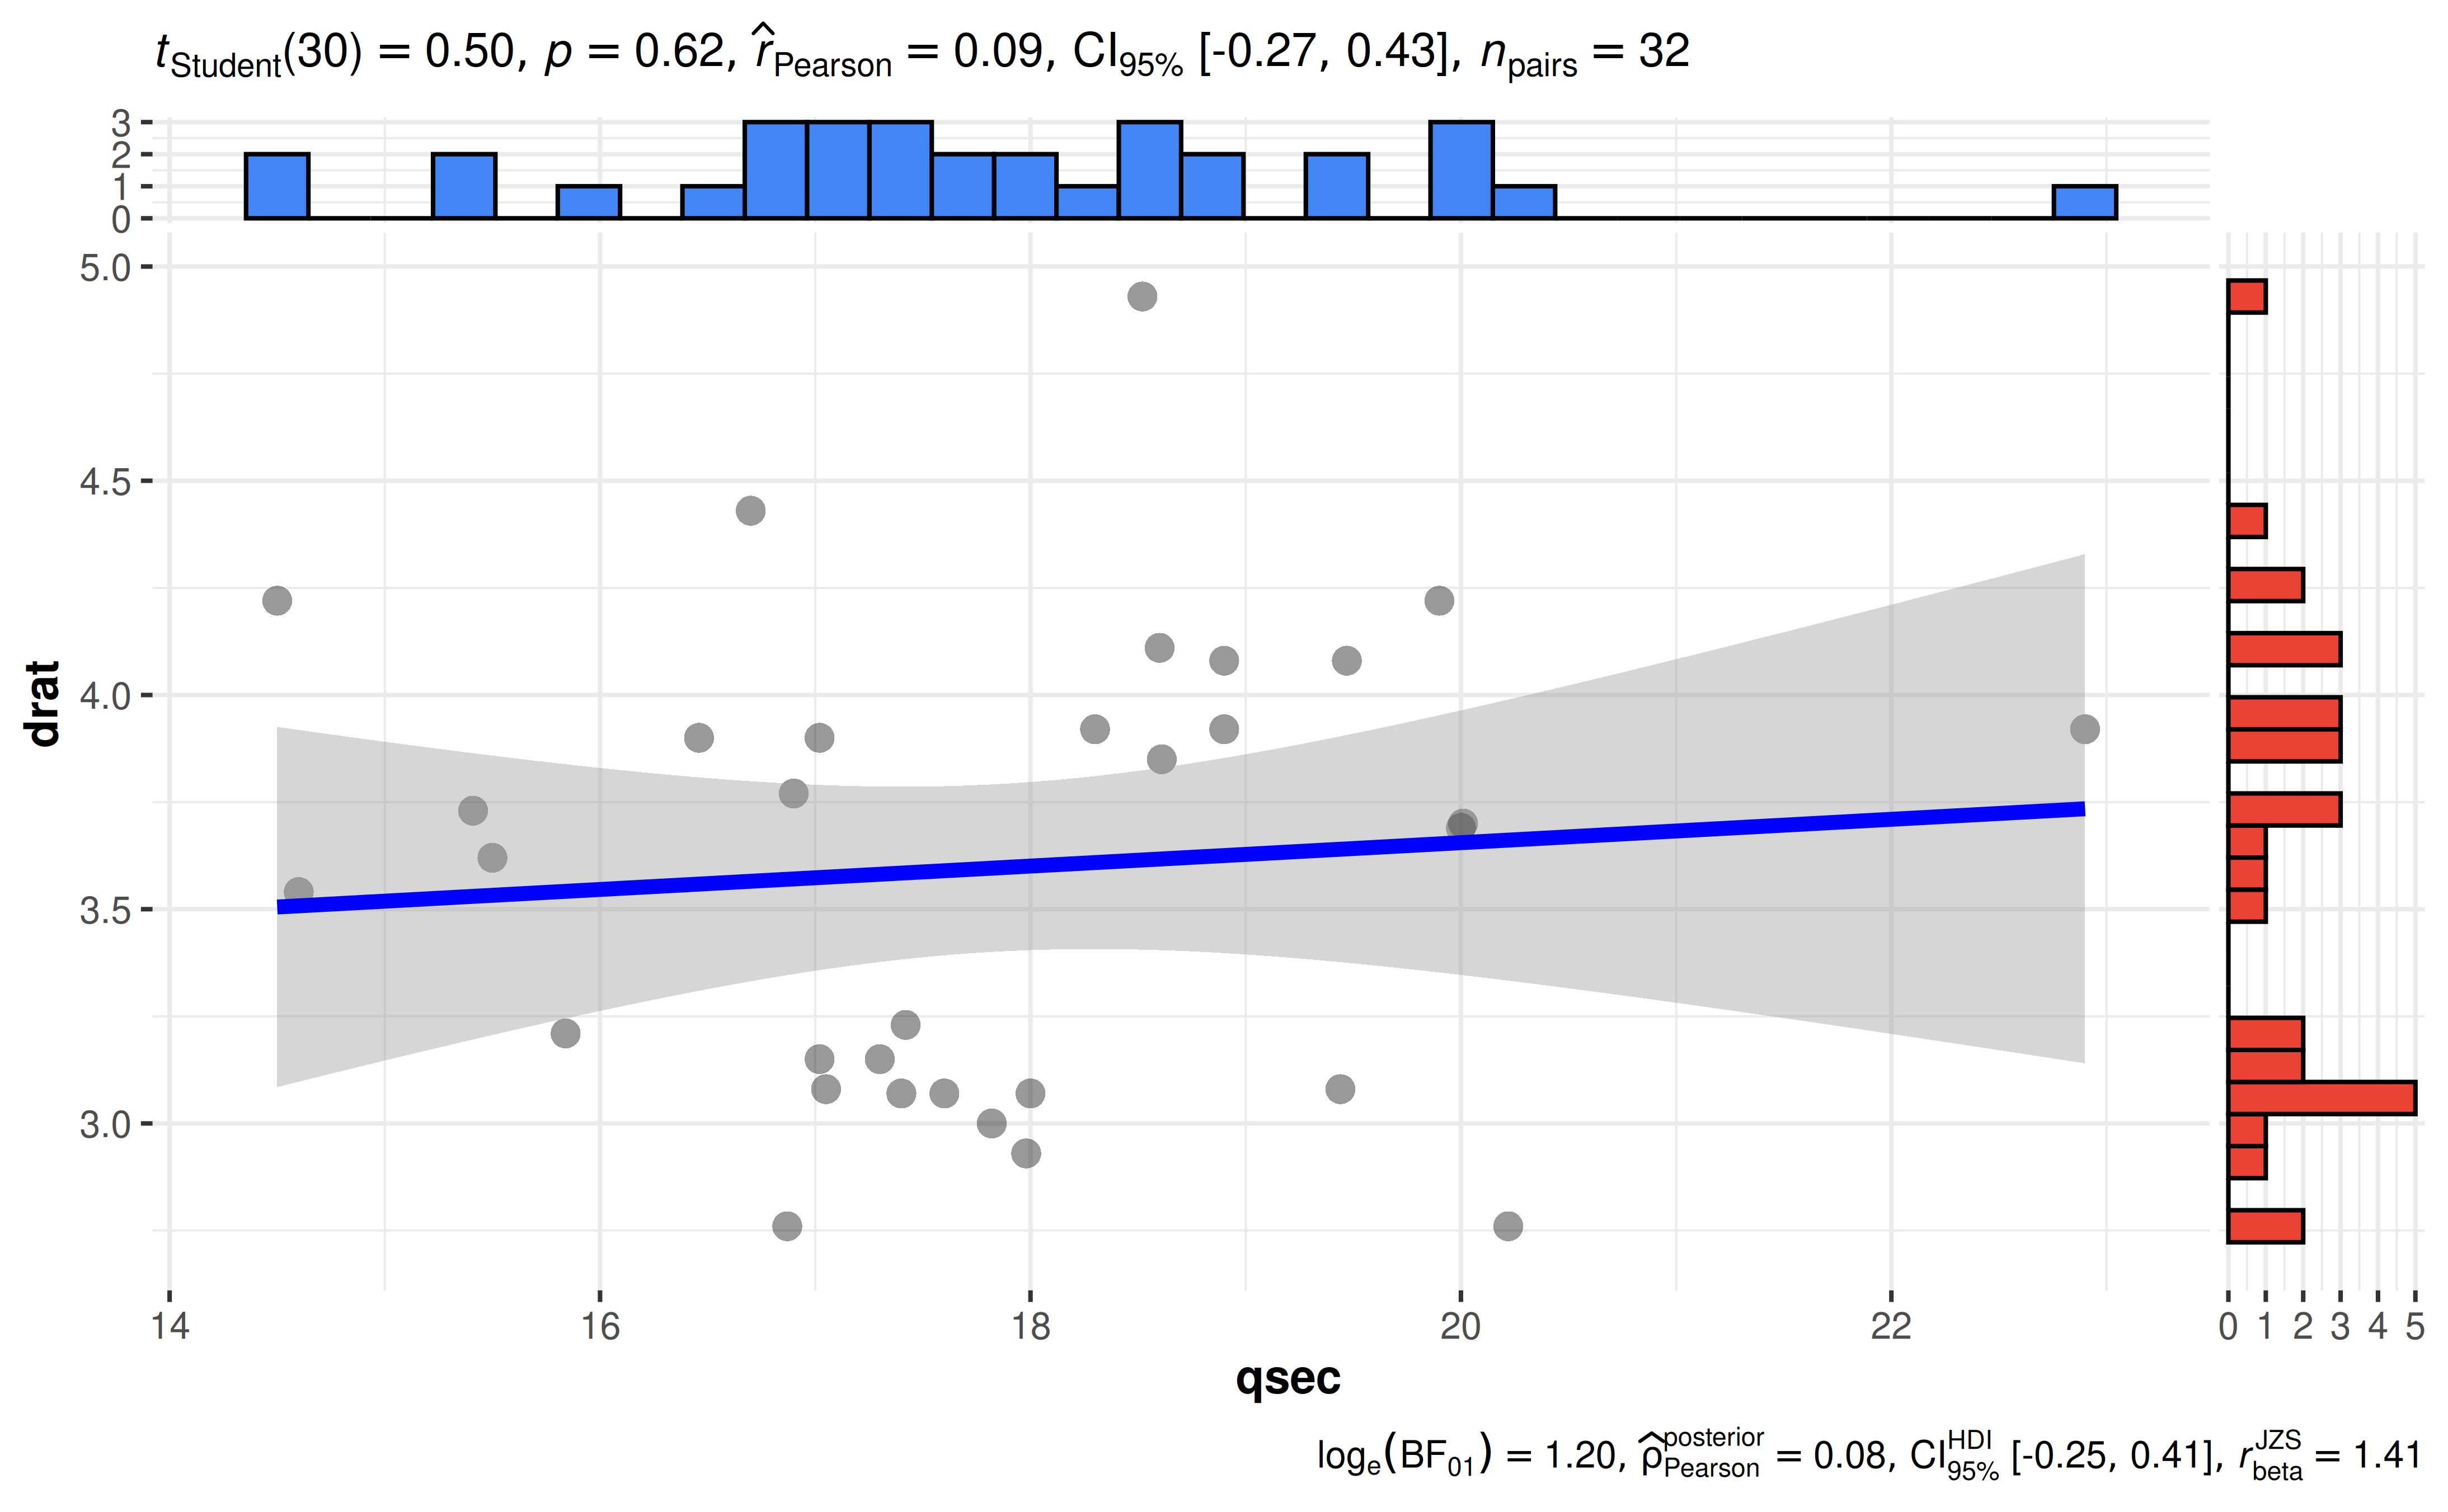
extract_stats(p)$subtitle_data
#> # A tibble: 1 × 14
#>   parameter1 parameter2 effectsize          estimate conf.level conf.low
#>   <chr>      <chr>      <chr>                  <dbl>      <dbl>    <dbl>
#> 1 qsec       drat       Pearson correlation   0.0912       0.95   -0.266
#>   conf.high statistic df.error p.value method              n.obs conf.method
#>       <dbl>     <dbl>    <int>   <dbl> <chr>               <int> <chr>
#> 1     0.426     0.502       30   0.620 Pearson correlation    32 normal
#>   expression
#>   <list>
#> 1 <language>
Reporting
If you wish to include statistical analysis results in a publication/report, the ideal reporting practice will be a hybrid of two approaches:
the ggstatsplot approach, where the plot contains both the visual and numerical summaries about a statistical model, and
the standard narrative approach, which provides interpretive context for the reported statistics.
For the example above, the narrative context could read:
Pearson’s correlation test revealed that, across 32 cars, a measure of acceleration (1/4 mile time;
qsec) was positively correlated with rear axle ratio (drat), but this effect was not statistically significant. The effect size was small, as per Cohen’s (1988) conventions. The Bayes Factor for the same analysis revealed that the data were 3.32 times more probable under the null hypothesis as compared to the alternative hypothesis. This can be considered moderate evidence (Jeffreys, 1961) in favor of the null hypothesis (of absence of any correlation between these two variables).
Suggestions
If you find any bugs or have any suggestions/remarks, please file an issue on GitHub: https://github.com/IndrajeetPatil/ggstatsplot/issues
Citation
You can cite this package/vignette as:
To cite package 'ggstatsplot' in publications use:

  Patil, I. (2021). Visualizations with statistical details: The
  'ggstatsplot' approach. Journal of Open Source Software, 6(61), 3167,
  doi:10.21105/joss.03167

A BibTeX entry for LaTeX users is

  @Article{,
    doi = {10.21105/joss.03167},
    url = {https://doi.org/10.21105/joss.03167},
    year = {2021},
    publisher = {{The Open Journal}},
    volume = {6},
    number = {61},
    pages = {3167},
    author = {Indrajeet Patil},
    title = {{Visualizations with statistical details: The {'ggstatsplot'} approach}},
    journal = {{Journal of Open Source Software}},
  }