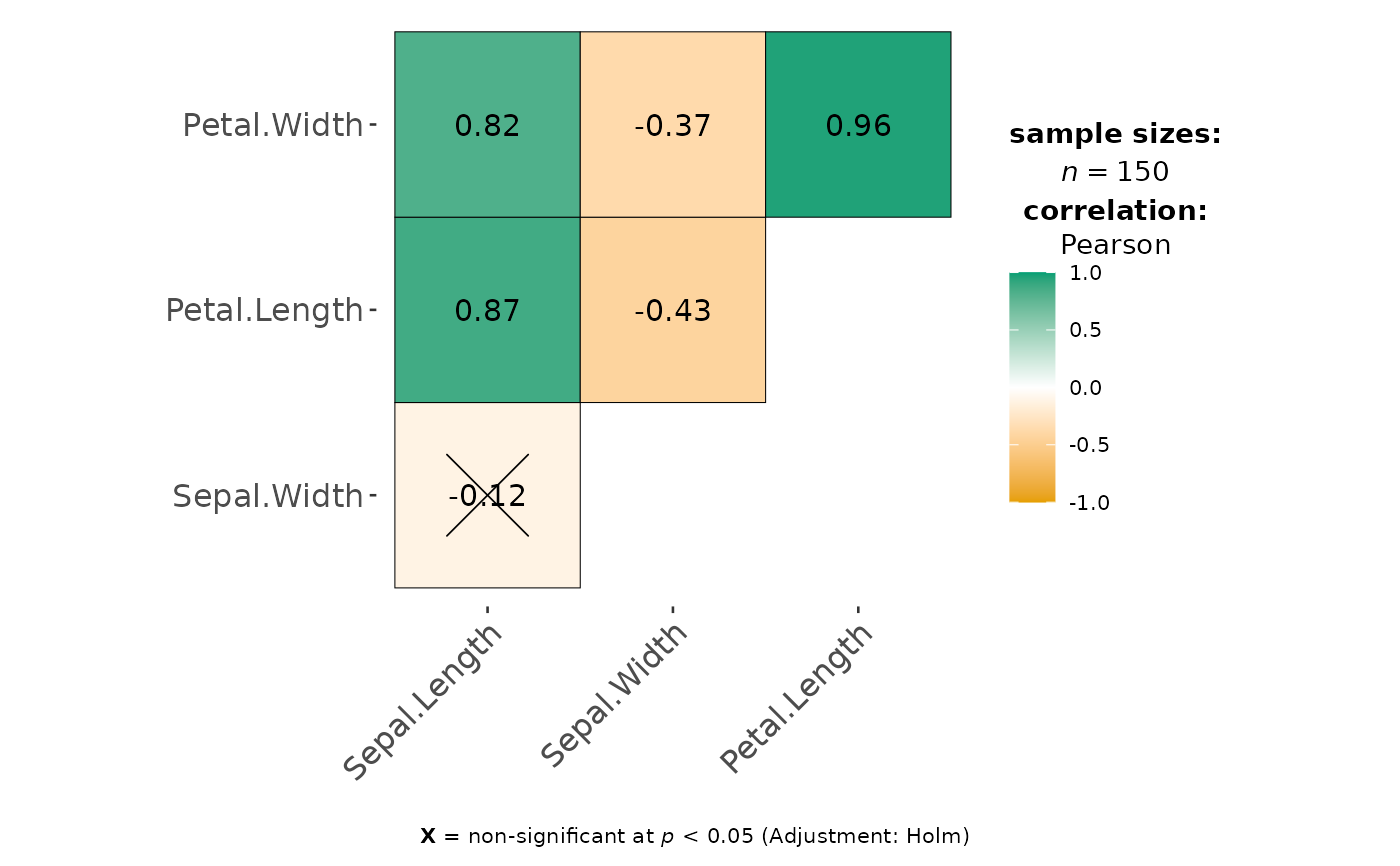
Correlation matrix containing results from pairwise correlation tests.
If you want a data frame of (grouped) correlation matrix, use
correlation::correlation() instead. It can also do grouped analysis when
used with output from dplyr::group_by().
Usage
ggcorrmat(
  data,
  cor.vars = NULL,
  cor.vars.names = NULL,
  matrix.type = "upper",
  type = "parametric",
  tr = 0.2,
  partial = FALSE,
  digits = 2L,
  sig.level = 0.05,
  conf.level = 0.95,
  bf.prior = 0.707,
  p.adjust.method = "holm",
  colors = c("#EA4335", "white", "#4285F4"),
  pch = "cross",
  ggcorrplot.args = list(method = "square", outline.color = "black", pch.cex = 14),
  ggtheme = ggstatsplot::theme_ggstatsplot(),
  ggplot.component = NULL,
  title = NULL,
  subtitle = NULL,
  caption = NULL,
  ...
)
Arguments
- data
A data frame from which variables specified are to be taken.
- cor.vars
Variables for which the correlation matrix is to be computed and visualized, specified using
{tidyselect}syntax (e.g.,c(var1, var2)orstarts_with("Sepal")). IfNULL(default), all numeric variables fromdatawill be used.- cor.vars.names
Optional list of names to be used for
cor.vars. The names should be entered in the same order.- matrix.type
Character,
"upper"(default),"lower", or"full", to display the upper triangular, lower triangular, or full matrix, respectively.- type
A character specifying the type of statistical approach:
"parametric""nonparametric""robust""bayes"
You can specify just the initial letter (e.g.
"np"or"bf"). Matching is on the initial lowercase letter only, so any other value (including capitalized values such as"Bayes") falls back to"parametric"without a warning.- tr
Trim level for the mean when carrying out
robusttests. In case of an error, try reducing the value oftr, which is by default set to0.2. Lowering the value might help.- partial
Can be
TRUEfor partial correlations. For Bayesian partial correlations, "full" instead of pseudo-Bayesian partial correlations (i.e., Bayesian correlation based on frequentist partialization) are returned.- digits
Number of digits for rounding or significant figures. May also be
"signif"to return significant figures or"scientific"to return scientific notation. Control the number of digits by adding the value as suffix, e.g.digits = "scientific4"to have scientific notation with 4 decimal places, ordigits = "signif5"for 5 significant figures (see alsosignif()).- sig.level
Significance level (Default:
0.05). If the (adjusted; seep.adjust.method) p-value is bigger thansig.level, then the corresponding correlation coefficient is regarded as insignificant and flagged as such in the plot. Ignored fortype = "bayes".- conf.level
Scalar between
0and1(default:95%confidence/credible intervals,0.95).- bf.prior
A number between
0.5and2(default0.707), the prior width to use in calculating Bayes factors and posterior estimates. In addition to numeric arguments, several named values are also recognized:"medium","wide", and"ultrawide", corresponding to r scale values of1/2,sqrt(2)/2, and1, respectively. In case of an ANOVA, this value corresponds to scale for fixed effects.- p.adjust.method
Adjustment method for p-values for multiple comparisons. Possible methods are:
"holm"(default),"hochberg","hommel","bonferroni","BH","BY","fdr","none".- colors
A character vector of exactly three colors for the gradient: low (negative correlations), mid (zero), and high (positive correlations). Must be a diverging palette so that the sign of the correlation is visually obvious. Default:
c("#EA4335", "white", "#4285F4")(red-white-blue).- pch
Decides the point shape to be used for insignificant correlation coefficients. Default:
pch = "cross". The caption explaining the insignificance marker is added only forpch = "cross"(or4).- ggcorrplot.args
A list of additional (mostly aesthetic) arguments passed to
ggcorrplot::ggcorrplot(). Do not include the following arguments, which are set internally:corr,p.mat,sig.level,ggtheme,colors,type,lab,pch,legend.title,digits.- ggtheme
A
{ggplot2}theme (Default:theme_ggstatsplot()). Any{ggplot2}theme (e.g.,ggplot2::theme_bw()) or theme from an extension package (e.g.,ggthemes::theme_fivethirtyeight()) can be used. Note that some themes remove plot details. For example,ggthemes::theme_fivethirtyeight()removes the secondary Y-axis, whichggbetweenstats()uses to show details about pairwise comparisons.- ggplot.component
A
{ggplot2}component, or a list of components, to add to the plot (Default:NULL). This is mostly helpful for thegrouped_variants, where it is applied to each individual plot.- title
The text for the plot title.
- subtitle
The text for the plot subtitle.
- caption
The text for the plot caption. If the insignificance marker caption is shown (see
pch), this text is displayed above it.- ...
Additional arguments (currently ignored).
Value
A ggplot object, which can be further modified with {ggplot2}
functions. Note that extract_stats() does not return statistical
details for this plot; use correlation::correlation() instead.
Details
Missing values are handled using pairwise deletion (each correlation uses all complete pairs of observations). If sample sizes then differ across pairs, the legend shows their minimum, mode, and maximum. Partial correlations use only complete cases.
For details, see: https://www.indrapatil.com/ggstatsplot/articles/web_only/ggcorrmat.html
Summary of graphics
| graphical element | geom used | argument for further modification |
| correlation matrix | ggcorrplot::ggcorrplot() | ggcorrplot.args |
Correlation analyses
Below is a summary of:
the statistical test carried out for inferential statistics
the type of effect size estimate and a measure of uncertainty for this estimate
the functions used internally to compute these details
Hypothesis testing and effect size estimation
| Type | Test | CI available? | Function used |
| Parametric | Pearson's correlation coefficient | Yes | correlation::correlation() |
| Non-parametric | Spearman's rank correlation coefficient | Yes | correlation::correlation() |
| Robust | Winsorized Pearson's correlation coefficient | Yes | correlation::correlation() |
| Bayesian | Bayesian Pearson's correlation coefficient | Yes | correlation::correlation() |